

Last Updated on Feb 21, 2025 by Harshit Singh
To continually offer a better stock analysis experience on Tickertape, we have released a brand new feature in our series of updates. Here’s a hint. Summarising stock analysis, say, in under 2 minutes, seems unreal, isn’t it? But we thought, why not make it easier for you? Here’s what we did to expedite your stock analysis process.
Table of Contents
What’s new on Tickertape?
One of the most loved features of Tickertape’s Asset Pages is the handy ‘Investment Checklist’, which helps make quick analysis on the viability of an investment. Earlier, this was solely focused on qualitative data. But since investing is a pure number game, clarity and access to transparent quantitative data are paramount when making a decision.
That is why we have introduced the ‘Scorecard’, which makes the checklist quantitative. Learn more about the Scorecard here. More about it here:
1. Get quantitative insights on quick stock analysis
The Scorecard assigns scores or ranks to important parameters you would look at when evaluating a stock. The scores are as follows:
- Performance and financial score: First four cards, namely, Performance, Valuation, Growth, and Profitability, summarize the performance and financials of the company with scores on a scale of 0 to 10. Note that this is a Pro-only feature. Subscribe to a suitable Tickertape Pro plan to access it.
- Entry point based on fundamentals and technicals: These cards help evaluate if a stock is worth buying at the current price relative to its intrinsic value and at the current price (based on technical indicators).
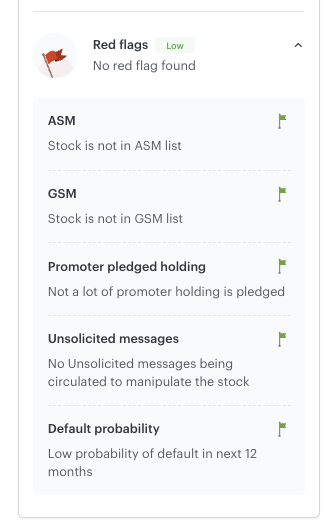
- Red flags: These are divided into five separate metrics to give you clarity on what exactly the red flags are.
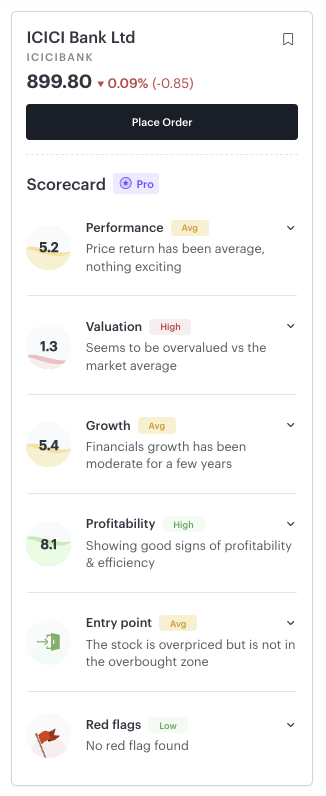
These scores give actionable information and allow you to make quicker, data-backed conclusions on whether a stock is good to invest in or not. Moreover, these take the stock’s peers into consideration, so you know how a particular stock is faring in the industry.
2. Transparent scoring system
The Scorecard is very transparent about the data that is used to assign scores. When you expand each of the above Scores, you will find the metrics used in calculating them. For instance:
- Performance Score is calculated using 1Y return, 5Y CAGR, and 1Y forecast. Note that you would need to be a Tickertape Pro Member to access this feature.
- Valuation Score is calculated using the PE ratio, PB ratio, and P/CFO.
- Red Flags is a combination of five items: promoter pledged holding, ASM and GSM lists, probability of default, and unsolicited messages.
By introducing the all-new Scorecard, we wanted to make stock analysis better and quicker for you! But more importantly, we wanted to give you actionable information in a transparent way to help you understand why a particular score is justified! We hope you enjoy using this feature just as we enjoyed building it. Update your Tickertape app today to try it out.

- Introducing Scorecard! Stock Analysis Got Quicker and Better With Quantitative Insights - Feb 21, 2025
- Diversification Score, Redflags and Portfolio Forecast: Our New Updates Make Portfolio Analysis Quick and Easy - Dec 13, 2022
- A Simple Way of Looking at Return Attribution in Your Portfolio - Sep 15, 2022
