

Last Updated on Dec 13, 2022 by
Stock analysis is often considered to be a time-consuming process. But it is a must-do activity to make the right buying decision. After that, it is a matter of weeding out the underperformers and holding on to or adding the best performers based on your current portfolio status. To help you do this, we have released new updates in ‘Portfolio’, which makes analysing your investments fairly easy.
We have added features like price forecast, diversification score, redflags, and more to give you deeper insights about your investment portfolio rather quickly. In this article, let’s take a look at a model Portfolio on Tickertape as an example and understand how to make the most of the ‘Portfolio’ updates to make rewarding decisions based on your current portfolio status.
Table of Contents
See your investments across sectors and market caps through the flow chart
We have added a visual flow chart to give you an instant peek into how your funds are invested across sectors and market-cap categories.
Following is the first-level, market cap-wise break-up of the portfolio. You can toggle between the ‘Invested’ and ‘Current’ options to know how much your money has grown.
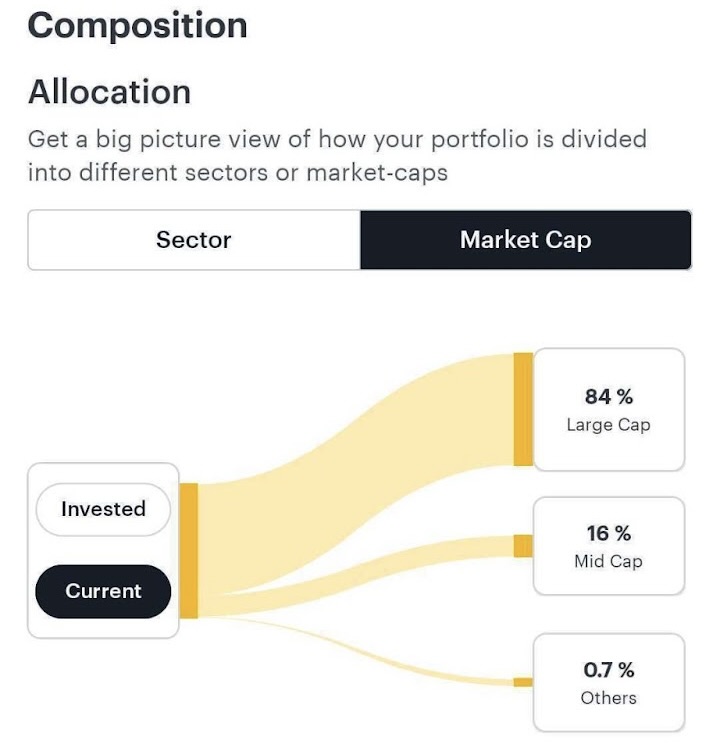
In the second-level breakdown, you can see the constituent stocks of the sectors or market cap categories.
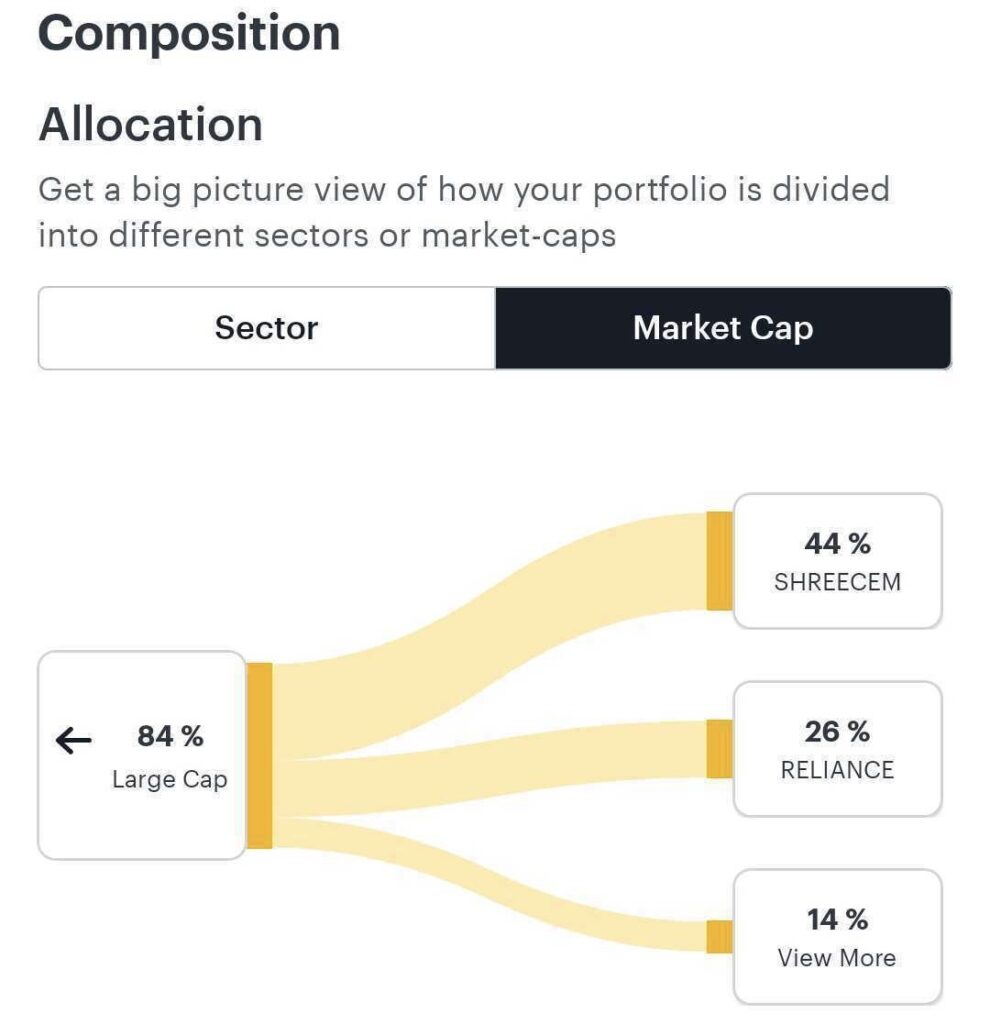
In the example portfolio, the large-cap category makes up 84% of the portfolio. Clicking on it will reveal all the stocks that belong to the particular sector.
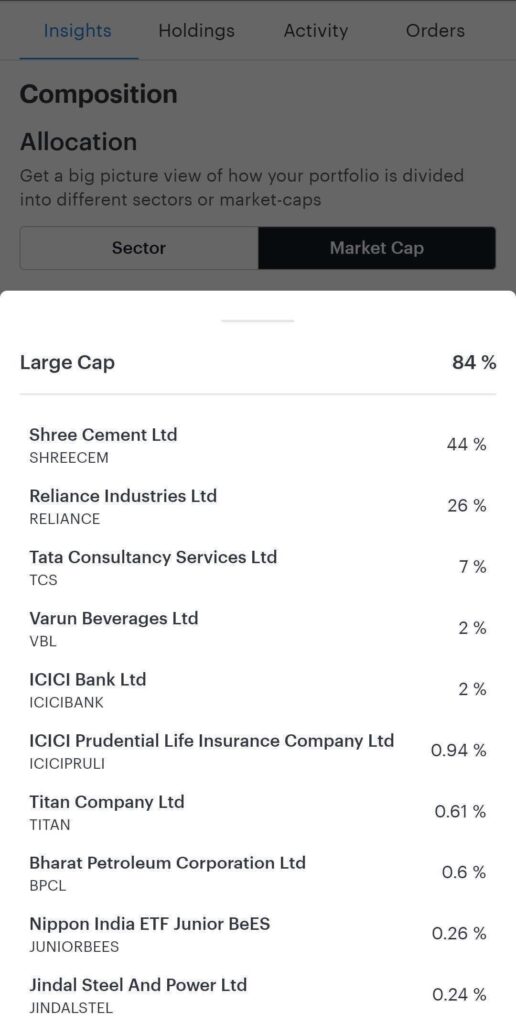
You can do a similar first-level and second-level portfolio analysis based on sectors.
Note that this feature is only available on the Mobile app.
Know how well-diversified your portfolio is using the diversification score
We’ve introduced the ‘Diversification score’ to give you a sense of how diversified your portfolio is compared to the Tickertape community. The Diversification score also indicates how volatile your portfolio is. Ranging from 1 to 100, the higher the score, the more diversified and less volatile your portfolio is.
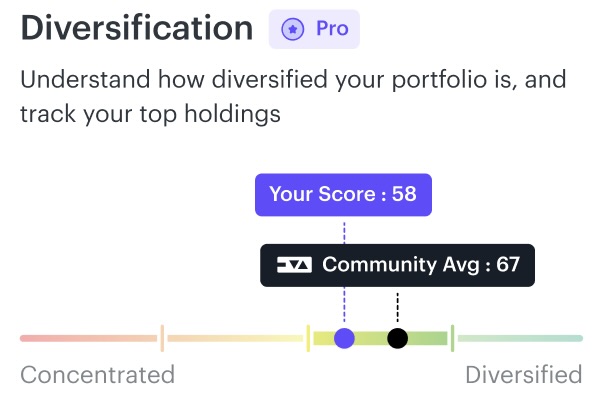
From the above image, you can see that the portfolio diversification score is 58 whereas the community average is 67. This indicates that there is scope to further diversify your portfolio by adding stocks of other sectors or market cap.
If you are wondering how the score is calculated, simply click on ‘How is Diversification score calculated’ to learn more.
Note that the Diversification Score is a Pro feature. Visit the Tickertape Pro Pricing Page to check out our Pro plans and subscribe now for more such features!
View your top holdings and their weightage in your portfolio in a jiffy
This section visually represents the top 3, 5, and 10 holdings of your portfolio. You can also find out the percentage of your portfolio that is part of these categories.
The Top 3 holdings, for instance, are Dr. Lal Path Labs, HDFC, and BSE, and they account for 28.56% of the portfolio. To take a look at the Top 5 and 10 holdings of your portfolio, move your cursor to Top 5 holdings and Top 10 holdings

Monitor your smallcase portfolio on Tickertape
We have integrated a ‘smallcase’ section under Portfolio to give you a sense of how they are performing from Tickertape itself. So now, you don’t have to log in to other applications separately to do this. In the ‘smallcase’ section of your portfolio, you get:
- The overview of your smallcase portfolio
- View the total amount invested in smallcases
- View the current amount and current returns
This helps you identify the top-performing smallcases and the laggards as well and thus helps you make better decisions based on the performance of the portfolio.

In the above picture, you can see that:
- 45% of your equity investments are done via smallcases
- Click on “View smallcase holdings” to see all the three smallcases that are part of your portfolio
- Know the top-performing smallcase of your portfolio
Understand how your portfolio is valued along with its volatility
The metrics section lets you analyse your portfolio based on two parameters – PE Ratio and volatility.
As you may know, the price-to-earnings (PE) ratio is used to value a stock. It is derived by dividing the current share price by the earnings per share.
Here, you can compare the PE ratio of your investment portfolio with the sector average and various benchmark indices. This tells how overvalued or undervalued your portfolio is compared to the sector or the index.
The picture below shows that the PE Ratio of the portfolio is 19.06 compared to the BSE 500, which means that the portfolio is undervalued.

Similarly, in the chart below, you can see that the portfolio is 2.5 times as volatile as the BSE 500 benchmark.

In case your portfolio is more volatile than the benchmark, you stand a chance to earn higher returns but at a higher risk. That said, if your risk tolerance is not as high, you can add more stable stocks to your portfolio to decrease the volatility of your portfolio.
One way you can do this is by adding stocks with a beta equal to or lower than 1. In contrast, if you have a high-risk appetite, you can add more stocks having a beta of more than 1. Alternatively, you can also add fundamentally-strong small-caps to your portfolio.
You can also compare the PE ratio and volatility of individual stocks in your portfolio against their benchmark indices. Simply click on “View sector premiums” and “View sector multiples to get these details.
Score your portfolio based on key fundamental and technical indicators
To help you weed out the underperformers in your investment portfolio, we have introduced an additional scoring methodology. There are four kinds of scores that you can use here:
- Valuation
- Momentum
- Growth
- Quality
In all the above cases, the higher the score, the better the stock is. To allow you to do a deeper analysis, we have added several tiers here. Stocks in Tier 1 of each category are the best based on the respective metric. The Tier 2 constituents are the next best. The rest of the Tiers come later. You can also see which stocks are part of the Tiers and the weightage they have in your portfolio.

Such scoring based on Tiers helps you identify the stocks that you would want to sell and the ones that you would want to buy more.
Suppose 75% of your portfolio is part of Tier 3 based on the valuation metric, this shows that your portfolio is majorly made up of overvalued stocks and hence is overvalued itself. In such a case, you may consider adding more undervalued stocks or selling a few overvalued stocks from your portfolio.
Identify stocks with potential redflags in your portfolio
If you could see stocks with redflags up front, you could avoid many mishaps in your investing journey. Redflags can be several. We already show whether a stock is included in the ASM and GSM list under the investment checklist of its Stock Page.
But with the new update, we collated these and two more redflags in one place in the Portfolio section so you can do a comprehensive analysis and make better selling decisions. Thanks to this, you won’t have to waste time checking for holdings with redflags individually.
Apart from ASM and GSM list redflags, you can also check for other redflags – stocks with high promoter pledged holdings and a high probability of default. These are key redflags that you should not miss checking on.
Under the Redflags section, you can not only see individual stocks having exposure to each of the above-mentioned redflags but also get their cumulative weightage in your portfolio. Naturally, the higher the weightage of stocks with redflags, the more you are at risk.

In the above example, you can see that 6 stocks, accounting for 14.5% of the portfolio, have redflags. Clicking on each redflag will show you the individual stocks that have issues. If a particular stock with redflags has a higher weightage, you may consider selling it.
See how your portfolio is expected to perform in the next 1 year
Price forecasts give you a rough idea of how much returns you can expect from your investment portfolio in a given period. We have added 1-yr price forecasts of all your holdings in one place in this new update. By virtue of this, you need not check price forecasts for individual stocks and keep track of them. Simply go to Portfolio to see the following:
- The price forecast of your portfolio as a whole
- The price forecasts of individual stocks
- The weightage of each stock in your portfolio
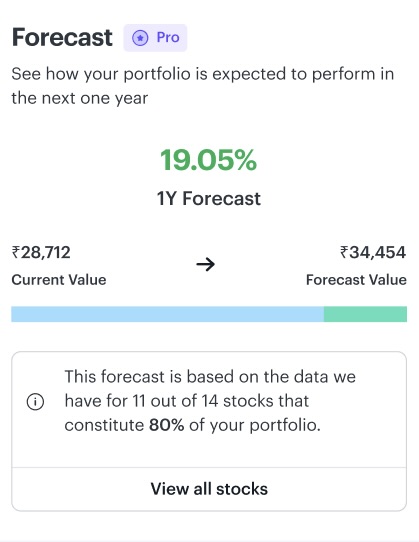
Click on “View all stocks” to get data on individual holdings.

Note that the Price Forecast is a Pro feature. Visit Tickertape Pro Pricing Page to check out our Pro plan features!
Once you invest and have a vibrant portfolio ready, monitoring its performance becomes key to earning good returns. However, portfolio analysis is not just a function of tracking the performance of investments but continually analysing them to take the right buying/selling decision.
Investing doesn’t have to be boring. And we are making sure to give you industry-best services that not only make investing a fruitful experience but also fun! Go ahead and explore these new Portfolio updates now!

- Introducing Scorecard! Stock Analysis Got Quicker and Better With Quantitative Insights - Feb 21, 2025
- Diversification Score, Redflags and Portfolio Forecast: Our New Updates Make Portfolio Analysis Quick and Easy - Dec 13, 2022
- A Simple Way of Looking at Return Attribution in Your Portfolio - Sep 15, 2022

