Last Updated on Jul 18, 2022 by Aradhana Gotur
“Investing is not rocket science. We repeat, investing is not rocket science.” No, this is not a script for a mike test scene.
We, in fact, want to show you how Tickertape challenges this notion, empowering you to make well-rounded, data-backed, and rewarding investment decisions.
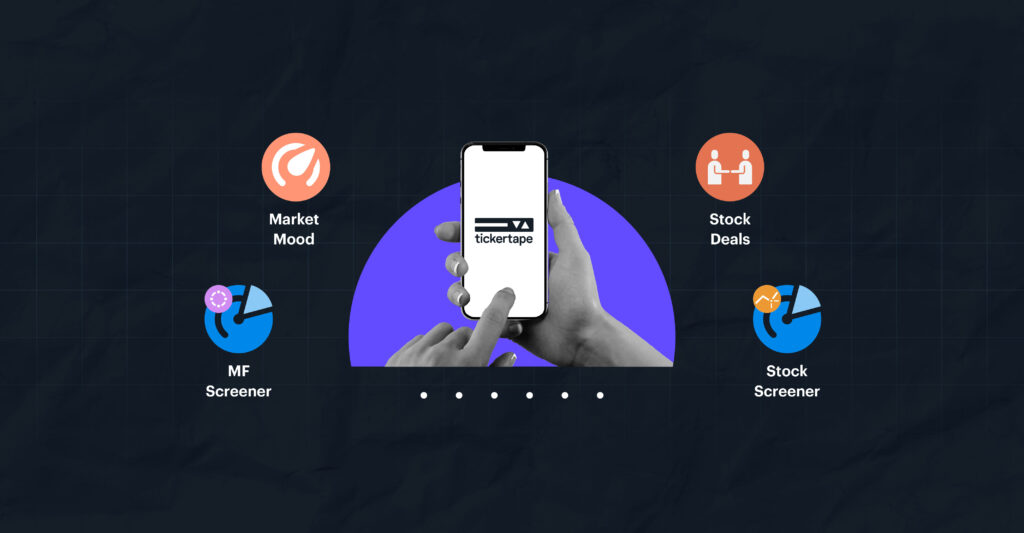
Here’s a quick overview of Tickertape’s smart tools and features.
Table of Contents
Discover investment opportunities with Stock Screener and Mutual Fund Screener
Put together, around 7,000 companies are listed on BSE and NSE! This means if you want to invest in a stock, you have to study the details of ~7,000 companies to choose one/few to invest in. This is certainly overwhelming and TIME-CONSUMING unless you are a computer yourself.
To help you discover stock ideas without putting in a lot of time and manual effort, Tickertape presents an intuitive Stock Screener. Built using over 200 filters, the Stock Screener helps you filter stocks based on your preference in no time.
Truth be told, you can filter stocks on Tickertape in under 2 minutes (sorry not sorry, Maggi ;)) All you have to do is apply filters that matter to you and boom, you get a ready list of stocks in line with your preference! Moreover, if you have a filter in your mind but can’t find it on Tickertape, worry not! You can create one using the custom filters feature.
To take this convenience a notch higher, we have added Pre-built Screens built on an idea or a theme like Money Minters, Cash-Rich Large-Caps, and Wealth Emissaries. Simply launch your preferred Screen and start filtering stocks that fit the idea right away! Here’s an article to help you get started with using Pre-built Screens and how to create one.
Similarly, the market is an ocean when it comes to mutual funds. With over 2,500 mutual funds schemes offered by registered Asset Management Companies, picking the one suitable for your financial goals can be a herculean task. But, with Tickertape Mutual Fund Screener, choosing the right mutual fund becomes a rather easy task. Built with 50+ filters, the screener helps you discover schemes for your varied goals, be it wealth creation, tax saving or liquidity.
If you wish to discover funds based on winning ideas we have built for you, choose from several readymade screens such as Value Picks, Consistent Outperformers, Long-term Compounders, and others.
Evaluate investments inside out using Asset Pages
A thorough analysis of investment is key to minimising losses and maximising returns. An example will demonstrate this idea in a better way.
Akshar and Kishan are friends who love discussing investments over tea. Part of the same WhatsApp group, they see a recommendation to buy Stock A, which is undervalued by 20% compared to its intrinsic value. Both of them find it to be an attractive investment. But, they know better; they decide to evaluate the stock before buying it.
Their analysis showed that the company’s operations were going fine, and it has been earning profits in the past years. All looked good so far for Kishan, who bought 100 stocks of Company A at Rs. 100 each. But Akshar decides to do some due diligence—analyse the stock further.
He takes a look at the company’s financials and finds out that its debt to equity (DE) ratio, which was 5, was very high compared to the sector DE ratio of 1. As per the fundamental analysis, the lower the DE ratio, the better it is for the company. This gave away that the company was overburdened with debt. In the financial statements, Akshar found out that the company’s total debt was indeed very high.
Sceptical about the stock, Akshar assesses it further and finds out that the stock price was falling over time. He decides not to bet his money on the stock. A few days later, Akshar and Kishan were sipping on tea and watching the news on TV. Company A, whose stock price was now down 50% from Rs. 100, had filed for bankruptcy.
The moral of the story: while Kishan’s investment of Rs. 10,000 was down to Rs. 5,000 in just a few days, Akshar had saved all the money he had intended to invest by not betting on the fundamentally-weak stock. What cost Kishan this loss was not doing a few minutes of analysis, which, in contrast, saved Akshar.
Be wise and use Tickertape’s Stock Pages to analyse a stock before buying or selling it. From key metrics like PE ratio, dividend yield, and debt to equity ratio to financials, corporate actions, and the latest news, Stock Pages host a wealth of information about the company.
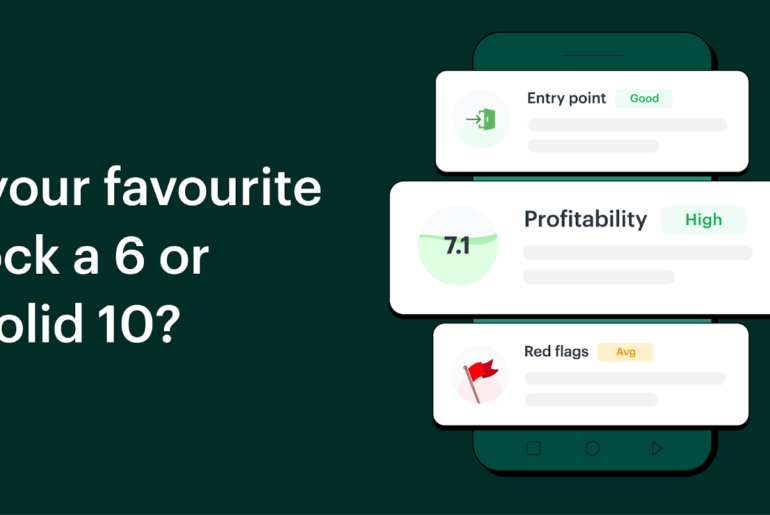
Not just stocks, you can also analyse Mutual Funds, ETFs, and indices on Tickertape. All these have dedicated Asset Pages, similar to Stock Pages, which allow you to do data-backed analysis. Each Asset Page features an investment checklist, a price/NAV chart, key metrics, financials, peer information, and the latest news to help you gauge the feasibility of investment.
Read more about the individual Asset Pages:
Place multiple buy and sell orders for stocks of multiple companies in one go
Picture this: After doing the groundwork of analysing your investments, you identify shares of three companies that you want to add to your portfolio and shares of two that you want to sell. In a typical scenario, on your broker platform, you would have to place five different transactions to buy and sell these stocks. But on Tickertape, you can do this in a single transaction, thanks to industry-first features – Basket and Transactions.
Using these features, you can now place a bulk order to buy and/or sell stocks of different companies in just one click. It’s simple, add your stocks to buy or sell in the ‘Basket’ and execute all of these orders in a SINGLE click via ‘Transactions’. Congrats! You can now save more of your precious time and efforts 🙂
Read about Basket and Transaction features in detail to get started. Make sure you are logged in to Tickertape via one of these brokers:
- Zerodha
- Groww
- Upstox
- Angel One
- 5paisa
- HDFC Securities
- AxisDirect
- IIFL Securities
- Alice Blue
- Kotak Securities
- Trustline
- ICICIdirect
- Trustline
Know the big investors’ outlook on a stock with Stock Deals
Stock Deals—insider trades and bulk and block deals—signify the big investors’ outlook of the company. These trades are initiated by institutional investors, high net-worth individuals, promoters, and top employees of a company. You may see consistent, bulk buying in a company if such big investors have a positive outlook about the company.
If not, you may see a consistent selling of stocks, which reflects a negative outlook. Play around with the Stock Deals feature and see the big investors’ outlook on your favourite stock. Note that Stock Deals is a premium-only feature, so make sure you have subscribed to Tickertape Pro. If not, you can subscribe to a plan that suits you best.
Gauge the emotion that is ruling the street with Market Mood Index
Note that the market’s sentiment is the function of the effect of the macro and global economic factors on the stock market. So the MMI should not be used to time the market instead, analyse the trend over time before buying or selling stocks.
Stock prices are heavily driven by two emotions. Hence, the market mood is classified into four zones:
- Fear zone
- Extreme fear zone
- Greed zone
- Extreme greed zone
Typically negative news on the global or national level that impacts the market instils fear in investors. In contrast, positive news boosts investors’ sentiment and makes them greedy.
While the fear zones indicate investors are wary about the markets, the greed zones mean they have a positive outlook. As such, when in greed zones, investors are typically looking to buy and contrary to this, they are looking to sell stocks in fear zones.
MMI is built using six important factors: FII Activity, Volatility and Skew, Momentum, Market Breadth, Price Strength and Demand for Gold, the MMI has exhibited 88.6% accuracy. Read how MMI is built and how you can use it to time your investments better to step up your investment game.
Track the performance of stocks and mutual funds using Watchlist
Tickertape’s Watchlist is not any other watchlist—it is distinct, improved, and more accommodative! Our Watchlist supports both equity/stocks and mutual funds and empowers you to:
- View bite-sized vital information about each stock/mutual fund that you want to track
- Sort securities by high and low prices for various timelines such as 1 month, 3 months, 6 months, and 1 year. In case of mutual funds, NAV for 1 month, 3 months, 6 months, and 1 year is available
- Group all stocks in your Equity Watchlist page based on the sector they belong to
- Copy all the stocks in the Equity Watchlist to the Basket and edit/modify them
- Duplicate the watchlist to create a replica of a current one
- Shortlist and trade your favourite Stocks/Mutual Funds
Read more about our improved Watchlist here.
Now that you know how Tickertape empowers you to make better investment decisions, use the tools and features before making any investment decision. Don’t chase returns. Do your best analysis of investments. Returns will chase you and how!


