Last Updated on Jun 3, 2022 by Aradhana Gotur
With every new release of filters on Tickertape’s Stock Screener, we strive to offer you a better stock-screening experience. This time around, we have added 14 new filters across three categories: valuation, income statement, and balance sheet and cash flow. Here’s a category-wise rundown of the same.
Table of Contents
Valuation
In stock parlance, valuation refers to ascertaining a company’s fair value or an investor’s perception of its worth based on specific data points. As such, filters under this category help evaluate whether a company is undervalued or overvalued. Following are the new valuation filters added to the screener.
| New Filter | Description |
| Sector PE Ratio | Sector PE is the average price to earnings ratio of a particular sector. |
| Sector PB Ratio | Sector PB is the average price to book value ratio of a particular sector. |
| Sector Dividend Yield | Sector Dividend Yield is the average dividend to price ratio of a particular sector. |
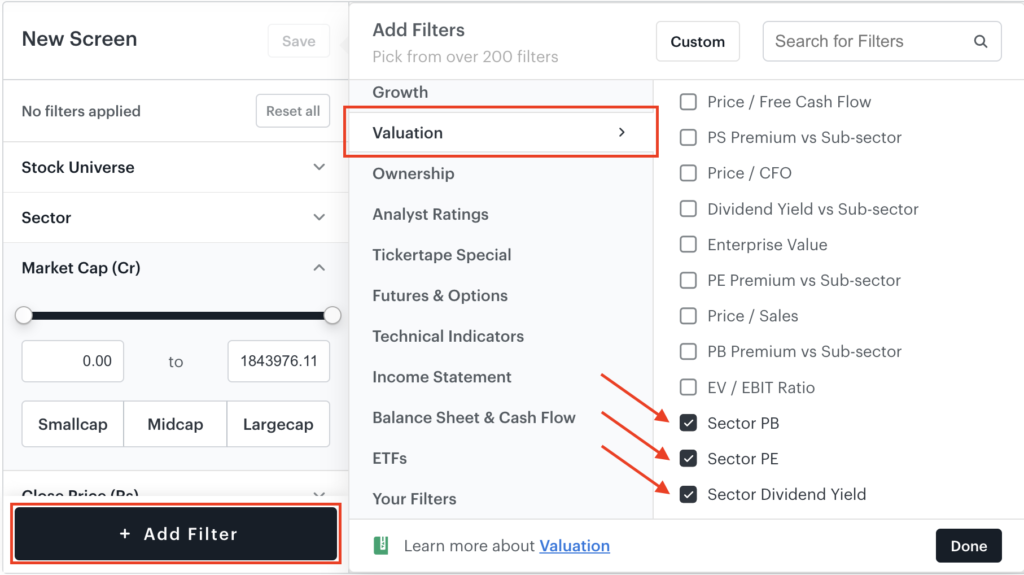
The price to earnings ratio or PE Ratio allows you to compare a company’s stock price to its earnings. This helps you evaluate whether a stock is overvalued or undervalued based on the earnings generated by the company. The PE Ratio of a stock is generally compared with its peers in the sector to determine whether it is overvalued or undervalued. Sector PE Ratio serves as an effective comparison benchmark for this purpose. If the company’s PE Ratio is lower than the Sector PE Ratio, it may suggest that the company is undervalued, and vice versa. However, it is important to further analyse the reasons behind undervaluation before deciding to buy the stock.
Similarly, the price to book ratio or the PB Ratio allows you to evaluate whether a stock is overvalued or undervalued compared to the company’s book value. The book value of a company refers to its tangible net asset value. It is arrived at by subtracting intangible assets (patents, goodwill, and so on) and liabilities from the total assets. Sector PB Ratio allows a comparison of a stock’s PB Ratio with that of its peers or the sector as a whole.
Income statement
The income statement of a company gives an insight into its income and expenses over a defined period, namely, quarterly and annually. It is also called a profit and loss (P&L) statement. Filters under these categories help evaluate a company’s profitability. We have added seven quarterly metrics to an already-existing pack of income statement-related filters to give you a more recent snapshot of a company’s performance. Quarterly numbers also give insights into the management’s current attitude and the immediate drivers of what went wrong and right in the company during the period. Take a look at the new filters under this category:
| New Filter | Description |
| Total Revenue (Q) | Revenue generated by the company in the most recent financial quarter |
| Net Income (Q) | Net income earned by the company in the most recent financial quarter |
| EBITDA (Q) | Gross profit minus operating cost for the latest financial quarter |
| EPS (Q) | Net income for the latest financial quarter divided by the total common shares outstanding of the company |
| Operating and Other Expenses (Q) | Other expenses incurred in operating the company like rent, servicing of machines, R&D, and so on for the latest financial quarter |
| PBIT (Q) | EBITDA minus depreciation and amortisation expense for the latest financial quarter |
| PBT (Q) | PBIT minus interest and other related items for the latest financial quarter |
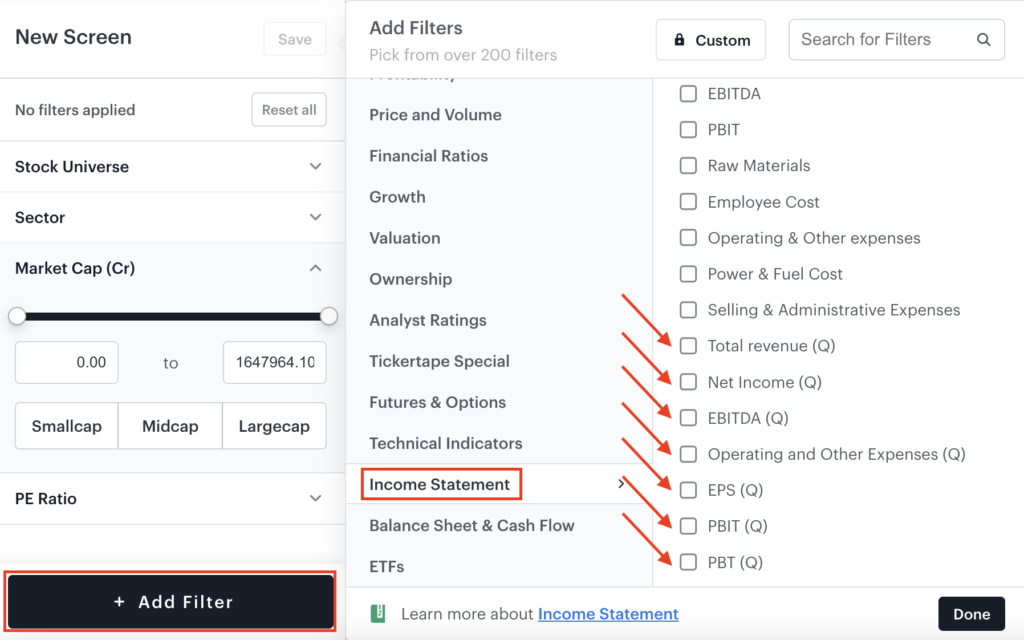
Quarterly net income is the total sales of the company less the cost of goods or services sold, operational expenses, taxes, and interest in the most recent financial quarter. A positive number means the company is profitable, and a negative number means it is loss-making. Quarterly EPS or earnings per share is a measure of how much a company has earned for each share of its outstanding common stock. It is calculated by dividing its quarterly net income by the total common shares outstanding. EPS is one of the most important metrics employed when determining a firm’s profitability.
Balance sheet and cash flow
These metrics are part of a company’s balance sheet. A balance sheet reports a company’s shareholder equity, assets, and liabilities. It paints a picture of how much a company owns and owes as of the date when the statement was drawn. Under this category, the new filters are:
| New Filter | Description |
| Other Current Assets | Uncommon assets held by a company which can be quickly converted to cash |
| Other Assets | Atypical assets held by a company that do not fall under the major asset category |
| Other Current Liabilities | Uncommon immediate obligations outstanding for a company not under any major liability type |
| Other Liabilities | Obligations outstanding for a company that do not fall under major liability category |
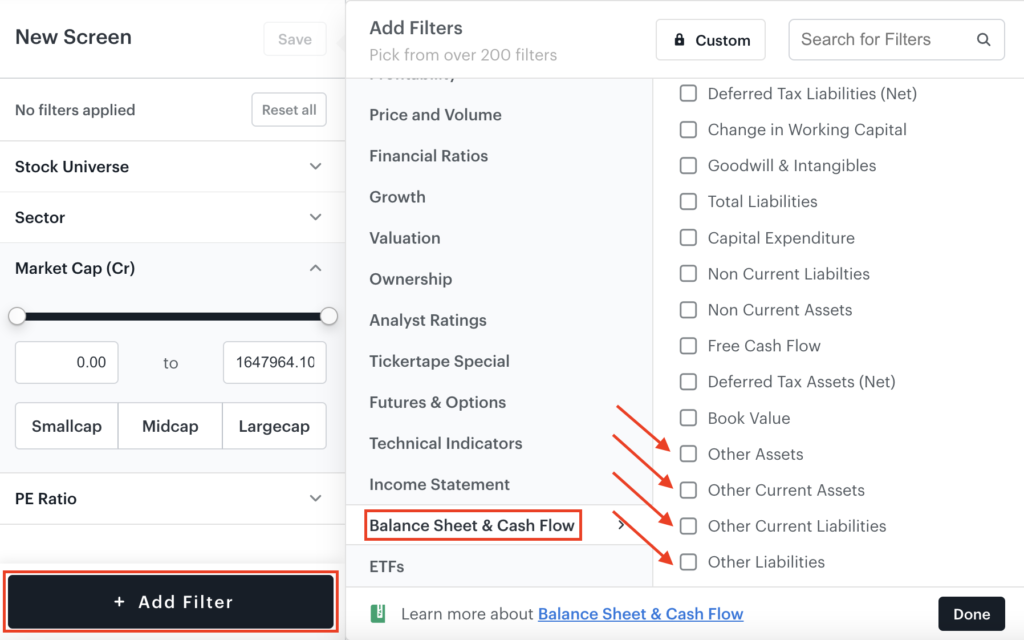
Other current assets are assets of a company that can be converted into cash within a year. They are referred to as “other” because they are uncommon, unlike typical current asset items such as cash, securities, accounts receivable, inventory, and so on. Examples of other current assets include advances paid to employees or suppliers, property that is being readied for sale and so on.
Similarly, other current liabilities are short-term debts that are due within a year. They are referred to as “other” because they are not significant enough to identify separately on their own lines in financial statements. Examples include advances from customers, unpaid services and so on.
These new filters have made Tickertape Stock Screener stronger, smarter, and sharper! Experience them first-hand today. Begin screening stocks right away!