

Last Updated on Jun 8, 2023 by Atif Ahmed
You’ve probably seen the news about ITC moving the D-Street, but how can you determine if it’s worth your attention? That’s where Scorecard comes in. It’s like your stock’s report card, which helps you quickly determine whether your favourite stock is a 4 or a stellar 10 out of 10. Let’s delve into this feature and discover its advantages using ITC as an example!
How can you assess a Stock with a Scorecard?
Scorecard is a concise tool that provides a snapshot of a stock’s performance, allowing you to rank a stock like ITC within seconds.
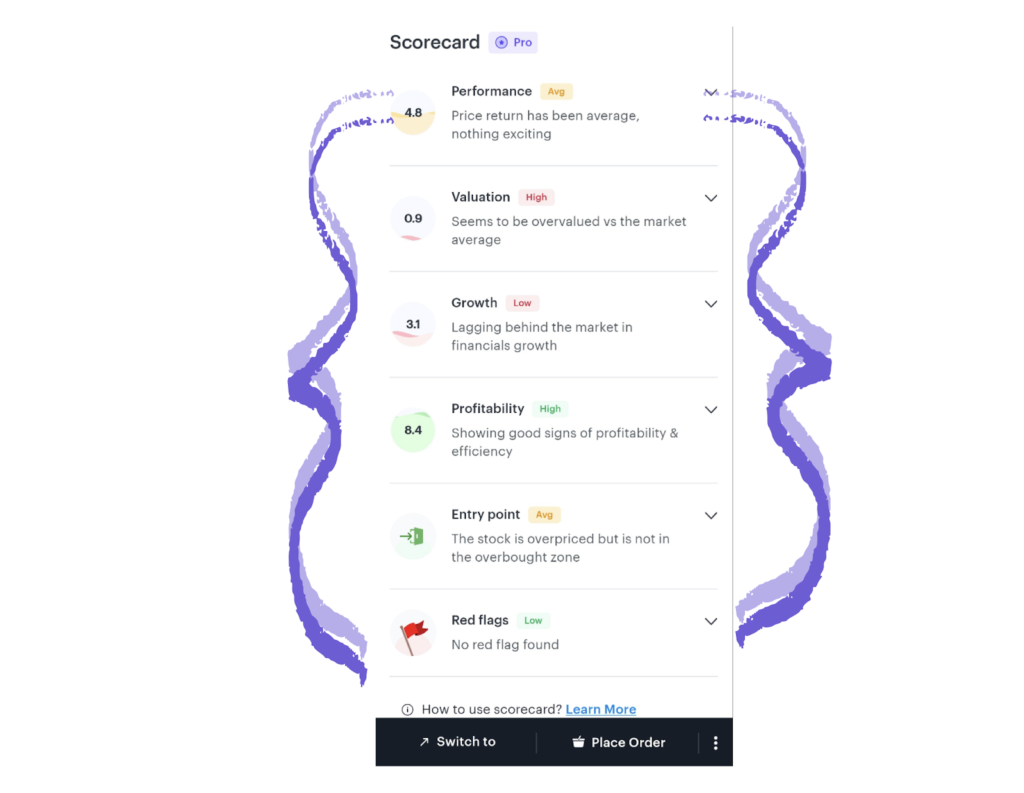
It works on four fundamental evaluation metrics:
.
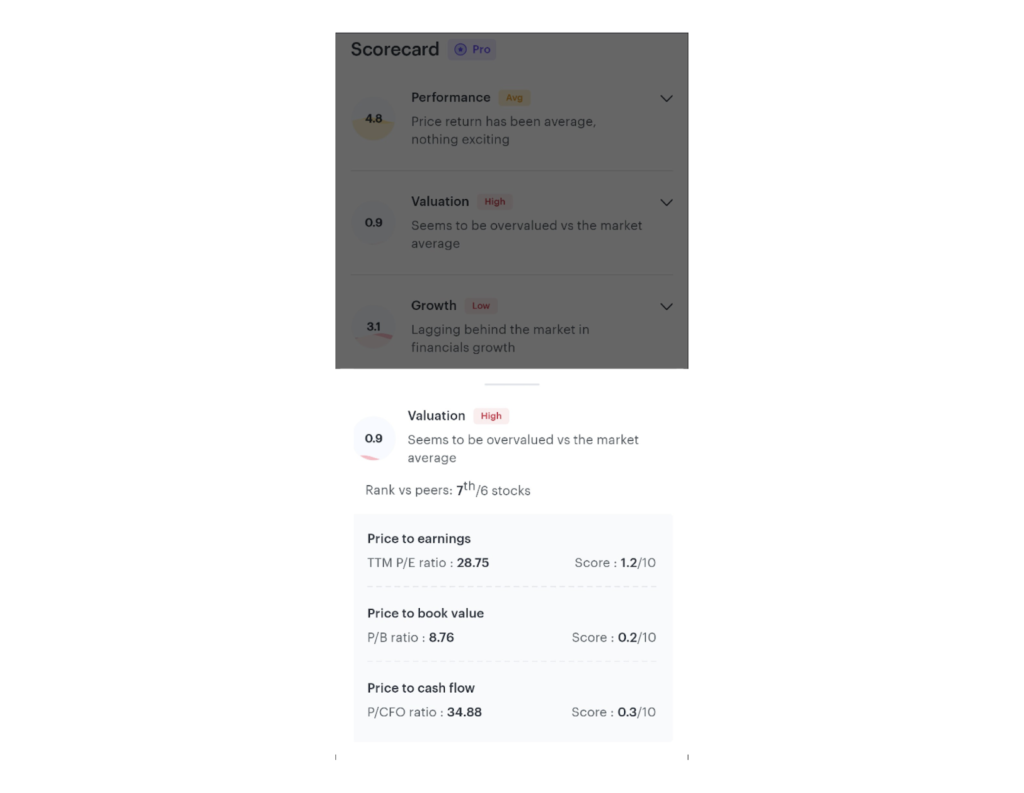
- Valuation: ITC’s valuation score is 0.9 out of 10, ranking it 7th among peers. This suggests the stock is relatively expensive compared to its peers and the market average, possibly overpriced. The Scorecard allows you to analyse that with a P/E ratio of 28.75, investors pay 28.75 times the company’s earnings per share, and these high ratios across earnings, book value, and cash flow indicate potential overvaluation. Take a look at the full picture here.
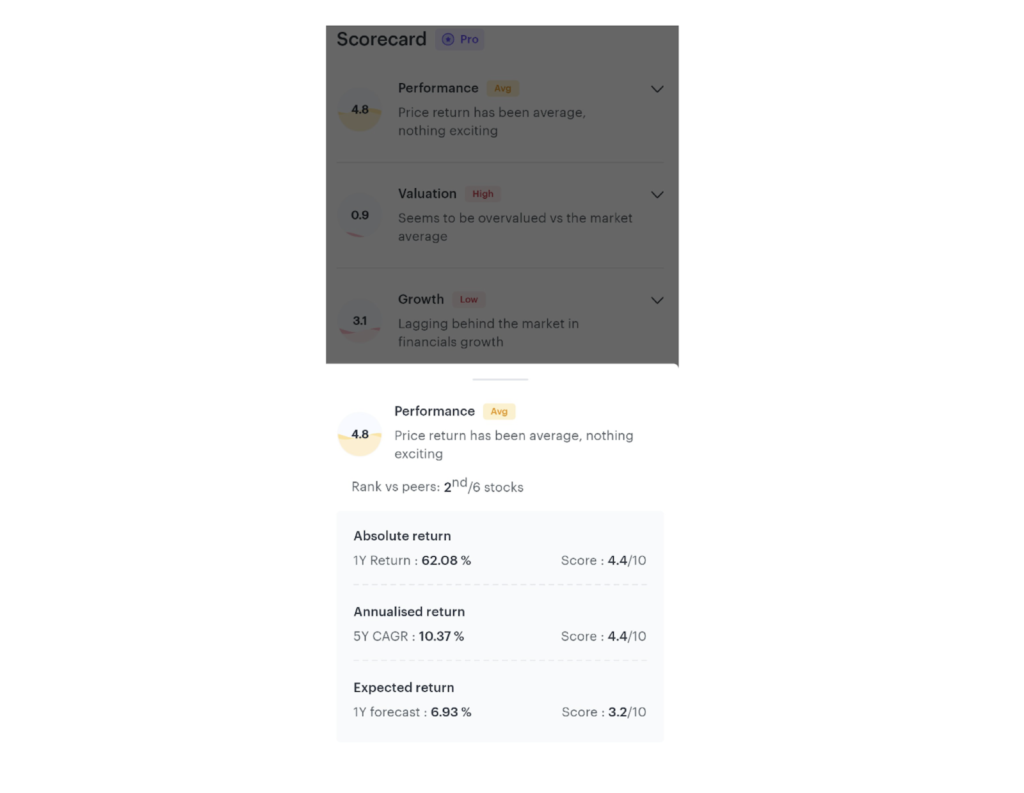
- Performance: ITC’s performance scorecard shows an average price return with a score of 4.8 out of 10. It holds the second position among peers, indicating a strong performance. With a positive 1Y return of 62.08%, the stock demonstrates promising performance. Overall, ITC’s performance on Scorecard indicates Price Return, Relative Rank, Absolute Return, and Annualised Return, have been average. For the coming year, the forecast suggests an average Expected Return, but until then, check out the full picture here
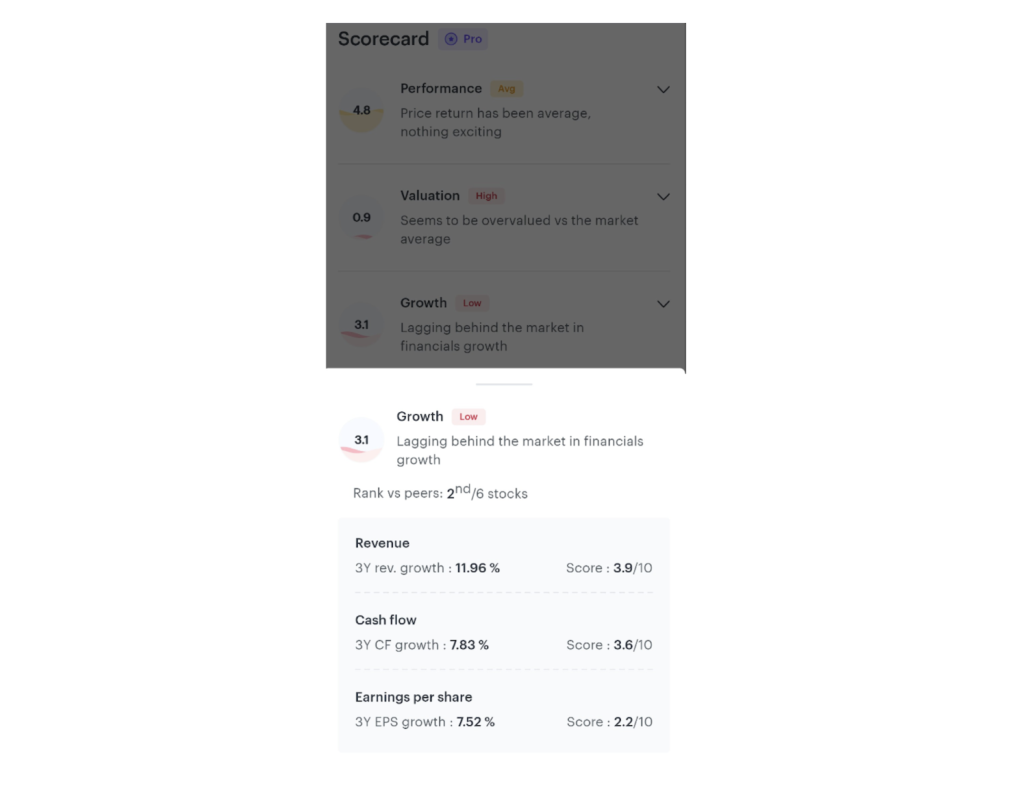
- Growth: Ranking at number two amongst 6, ITC has a growth score of 3.1 out of 10, which goes on to show that it shows promise within the sector. With projected revenue growth of 11.96% for the next 3Y, along with a 7.53% earnings per share growth as well, ITC is one of the strongest contenders in the sector that can give your money a run in terms of growth. Based on Scorecard’s Revenue, Cash Flow, and Earnings Per Share, it looks stable with more room to improve.
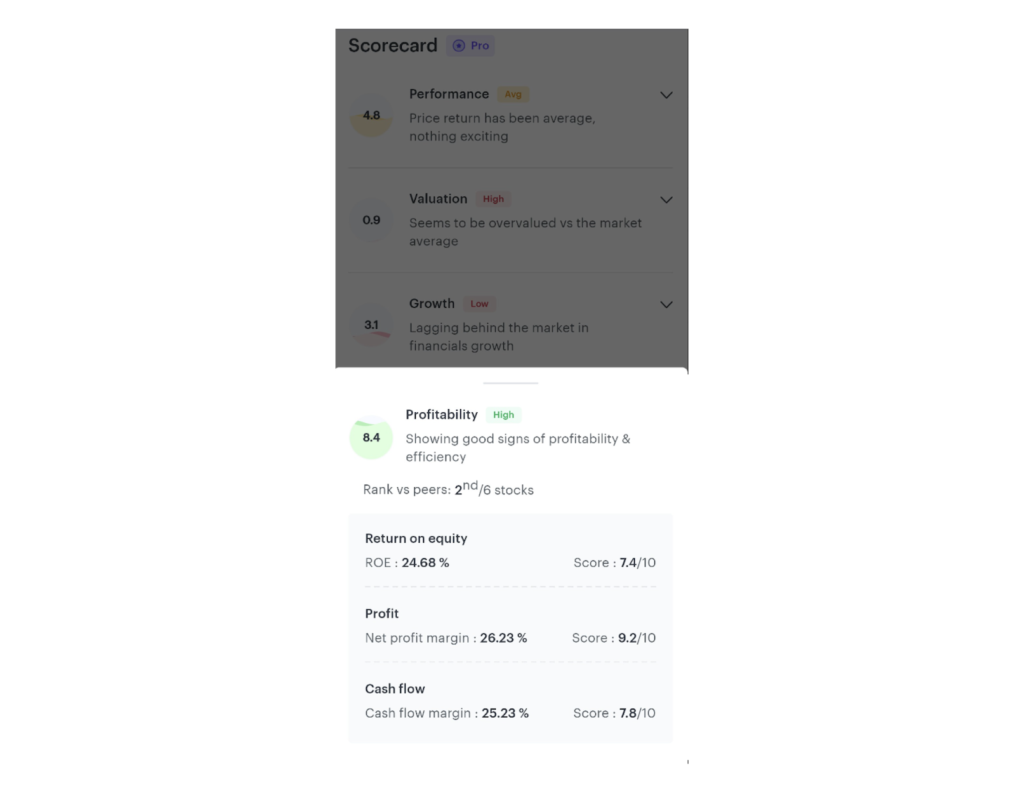
- Profitability: Last but not least, ITC and Profitability! This is one of the better combinations considering ITC has a solid score of 8.4 out of 10 while ranking at number two amongst its peers. A 24.68% return on equity mixed with a net profit margin of 26.33% is what makes ITC stand apart from the crowd. Showing good signs of profitability and efficiency, this stock has all eyes on it for the coming year!

Satisfied with the data? But to make your analysis even better, let’s take one final look at ITC’s Entry Point. Focused upon Technical and Fundamental indicators, ITC seems to be overpriced but not overbought, making it worth considering for your Portfolio! You can also check out if the current value is more than the intrinsic value or if it is a good time to enter or not for other stocks too here
Got more stocks to analyse? Use Scorecard to check if they deserve a spot in your Portfolio, all within seconds!


- Select Stocks With Analyst Ratings Filters - Jun 15, 2023
- ITC’s Report Card Is Here! - Jun 8, 2023
- Top 10 Most Popular Stocks on Tickertape - Jun 2, 2023


