Analysing the financial statements of a business helps investors decide whether to invest in the company. Moreover, for other stakeholders like creditors, suppliers, etc., the financial performance and net worth of the organisation they do business with is paramount. Ratio analysis helps interpret financial statements and measure a business’s performance quickly. Read more about ratio analysis below.
You will Learn About:
What is ratio analysis?
The term ‘Ratio analysis’ meaning refers to a tool for calculating and understanding a company’s financial standing, performance, liquidity, efficiency and profitability. Ratio analysis is conducted using the figures presented in a company’s financial statements, i.e., its income statement and balance sheet.
Return on equity: Highlights
- Ratio analysis helps measure a company’s performance, liquidity and other important aspects.
- There are different types of ratios which are used together for a complete insight into the company’s performance.
- Ratio analysis is vital for investors and financial analysts to understand the standing of a company.
Uses of ratio analysis
Ratio analysis is used for many reasons. Some of them include the following –
- To depict the actual financial position of a company.
- To calculate and compare financial data against competitors in similar industries.
- To assess the performance and operational efficiency.
- To analyse trends (Trend analysis becomes easier with ratio analysis. You can check the trend of how the company has performed over the years).
- To rectify deviations and make improvements if needed.
Framework for ratio analysis
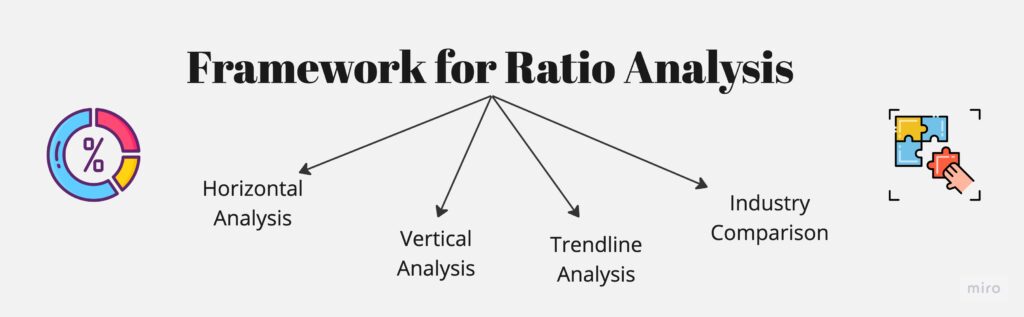
A single ratio might not give complete insight into the company’s efficiency. That is why different ratios are used to ascertain a company’s standing. Analysts also use a framework of ratio analysis, as stated below.
- Horizontal analysis
Horizontal analysis compares historical data and identifies a trend over time, i.e., across different financial years. In horizontal analysis, as the name suggests, you pick one parameter and look for its data over time in the horizontal row. Hence, it is always depicted as a percentage growth over a period of time for any parameter. For example, in the below-mentioned income statement, if you want to analyse total revenue for the last 3 yrs, you look at the Total Revenue row horizontally, compare yearly data, and deduct the conclusions.

Horizontal analysis allows you to spot growth patterns and forecast future projections. It allows you to look into the profitability of a company by comparing historical data and makes it easier to compare growth rates amongst sector competitors.
- Vertical analysis
Under vertical analysis, the items in a single vertical column are measured against one another. One base figure is considered, and other items in the vertical column are measured against the base. It allows you to check the parameters in relation to each other and provides an overall understanding of a company’s financials in terms of revenue and expenses. For instance, profit is compared against sales when calculating profitability ratios. Similarly, the cost is also compared against sales.
- Trend line analysis
A technique that utilises historical data, such as price movements and trade volume, to predict the future direction of market sentiment is known as trend analysis. By examining past patterns, it aims to anticipate upward trends and reversals within specific market segments, enabling businesses to better plan and prepare for potential changes.
The advantages of using trend analysis can be many. Two of them are –
- It can help in identifying opportunities for buying and selling securities.
- It can provide insight into market psychology and momentum.
However, if the data is inaccurate, incomplete, or flawed, the analysis can be inaccurate and may mislead. If used correctly, trend analysis can be a helpful technique as moving along with trends and not against them may result in profit for investors.
To know the current mood of the market, if it is greedy or fearful, use Tickertape’s Market Mood Index. It helps you time your investments better. Learn more about this tool here. And if you want to check it out, click here.

- Industry comparison
Industry comparison is comparing the ratios of one company against those of other companies in the same industry. This helps analysts decide whether the company is performing as other companies in the industry or does it needs improvement.
For instance, if the IT industry is considered, comparing Infosys with TCS will qualify as an industry comparison.
You can perform ratio analysis easily using Tickertape Asset Pages and Stock Screener. It allows you to perform peer comparisons, analyse financial statements, and provide essential information for ratio analysis. Start analysing today!
Types of ratio used in ratio analysis
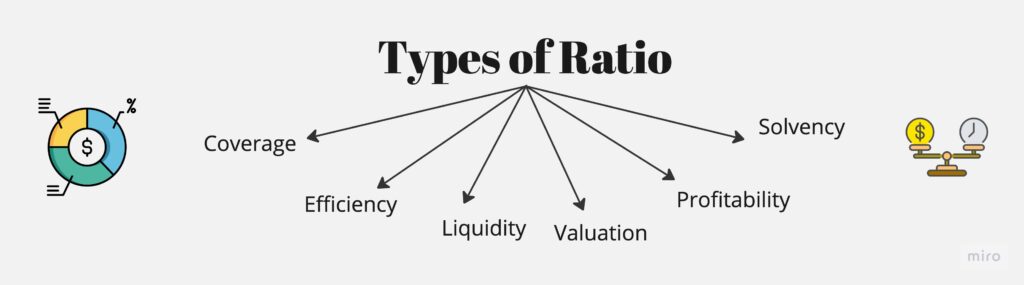
Different types of ratios are used to assess a company’s performance. The classification of ratio analysis is done as follows –
- Coverage ratios
Coverage ratios measure whether the business would be able to service and repay its debts. A higher ratio is favourable as it shows that the company is capable of repaying its debts on time. Coverage ratios are also helpful when comparing a company to its competitors in the same industry. Some common coverage ratios are:
- Interest coverage ratio
- Debt service coverage ratio
- Asset coverage ratio.
- Efficiency ratios
Efficiency ratios measure a company’s ability to manage its resources effectively. These ratios are commonly used in financial statement analysis to assess a company’s operational efficiency and performance. Usually, when there is an improvement in efficiency ratios, the business stands to generate more revenues and profits. Some common efficiency ratios are:
- Payables turnover
- Working capital turnover
- Fixed assets turnover
- Asset turnover
- Inventory turnover
- Receivables turnover ratio.
- Liquidity ratios
When a company is unable to pay its debt due to financial difficulties, it has the option to use its assets to settle debt with more ease. You can find if a company is capable of doing this using liquidity ratios. They measure a company’s ability to meet its debt obligations using its current assets. Liquidity ratios are usually used by banks and creditors to determine if a client has the ability to fulfil their obligations on time. Some common liquidity ratios are:
- Current ratio
- Cash ratio
- Quick ratio.
- Market Value or Valuation ratios
Also known as market prospect ratios, valuation ratios help investors understand their return on investment for a specific investment. The earnings can be in the form of dividends or higher stock value.
Valuation ratios measure a company’s worth. It analyses whether a company’s current share price is perceived as its true value. Valuation ratios compare the cost of security with the perks of owning the stock. Some valuation ratios include:
- Price-to-Earnings Ratio (P/E ratio)
- Dividend yield
- Payout ratio
- Earnings Per Share (EPS).
- Profitability ratios
These ratios measure the profitability of a business, i.e., how much profit it is earning vis-à-vis its sales and expenses. These ratios reveal the performance of a company in terms of generating profits. They also convey the competitiveness of the management. Some common profitability ratios are:
- Gross profit margin
- Net profit margin
- Return on Capital Employed (ROCE)
- Return on equity (RoE)
- Return on assets (RoA)
- Solvency ratios
Often referred to as leverage ratios, solvency ratios measure a company’s ability to sustain its day-to-day operations in the long term. It measures a company’s financial health by determining its ability to meet its long-term debt obligation. They are mostly used by the government, employees, banks, and institutional investors. The most common solvency ratios are the interest coverage ratio and debt-to-equity ratio.
Advantages of ratio analysis
- Helps management forecast future growth and company prospects and take corrective actions wherever required.
- Aids investors and other stakeholders make important decisions about transacting with the business.
- Helps assess liquidity, solvency and operational efficiency.
- Makes it easy to compare against similar businesses.
Disadvantages of ratio analysis
Though beneficial, the following are the limitations of ratio analysis –
- Ratios use historical data and figures to calculate efficiency. These figures might not hold true in the future and cannot be relied upon completely.
- If different businesses in the same industry use different accounting principles, comparability may not be feasible.
How does financial ratio analysis work?
Under financial ratio analysis, the data from the income statement and balance sheet is extracted. This data is then used to calculate the different financial ratios of the business, like liquidity ratios, solvency ratios, profitability ratios, etc.
Businesses calculate ratios quarterly or annually to assess their performance and take corrective measures in the case of deviations.
Who uses financial ratio analysis?
Financial analysis ratios are used by the following stakeholders –
- Financial managers of the business – They use the ratios to measure the financial performance of the company, its liquidity and solvency. The analysis helps them understand and make important financial decisions for the company.
- Business rivals – Competing businesses also use financial ratio analysis to assess how their competition is faring.
- Prospective and current investors – Investors use financial ratios to determine whether to invest or not in a company.
Conclusion
Ratio analysis helps interpret the financial data of a company to understand its true standing. Using ratio analysis, one can determine a company’s liquidity, profitability and overall performance. It is also an important tool for investors to understand the worth of a company when investing.
So, by understanding ratio analysis and its types, you can assess the company’s performance before investing.


