

Last Updated on May 22, 2023 by Ayushi Gangwar
Are you overwhelmed by the vast array of investment options available in the market? Tickertape, the ultimate investment research platform, is here to simplify your decision-making process. With a powerful set of filters at your disposal, Tickertape allows you to narrow down your investment choices based on specific criteria that matter to you. Let’s explore the Top 10 Filters offered by Tickertape:
Table of Contents
Beta
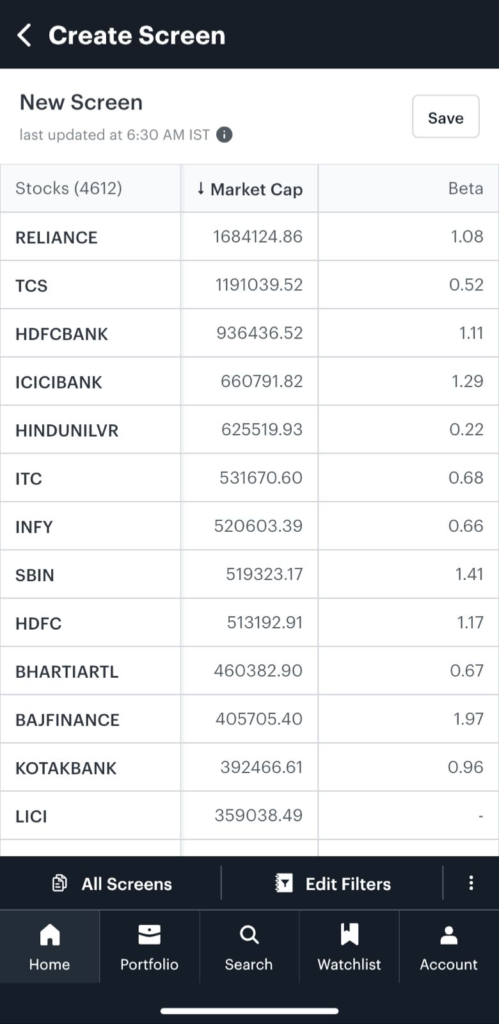
Beta is a measure of a company’s stock price risk in comparison to the market. A company’s stock price faces 2 different kinds of risk. The first one called the “unsystematic risk” is specific to the company and affects only the specific company. For example, a labour dispute in Maruti Suzuki will affect only shares of the company and not other shares in the market. However natural calamity, political instability etc. will affect all the participants in the market and hence is called “systematic risk”. Beta is a measure of systematic risk and indicates the extent to which the stock price will move in comparison to the market.
Companies whose beta is greater than 1 are classified as “high beta stocks”. The stocks of such companies are very volatile and move up or down a lot more than index prices. If the investor is foreseeing a bull run in the market, investing in such stocks might increase the possibility of better-than-market returns. “Low beta stocks” have a beta of less than 1 and are less volatile. Prices of such stocks are subdued when compared to index prices. These stocks usually act as a safeguard against a price drop in a bear market.
% Away From 52W High
% Away From 52W High refers to the percentage difference between the current price of a stock or asset and its highest price reached over the past 52 weeks (one year). It is a measure of how far the current price is from the highest price the asset has achieved within the previous year.
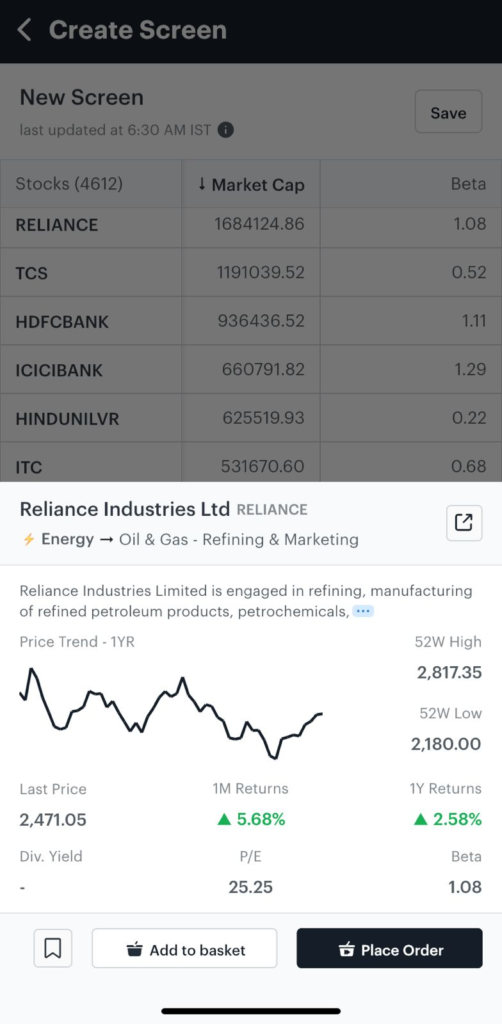
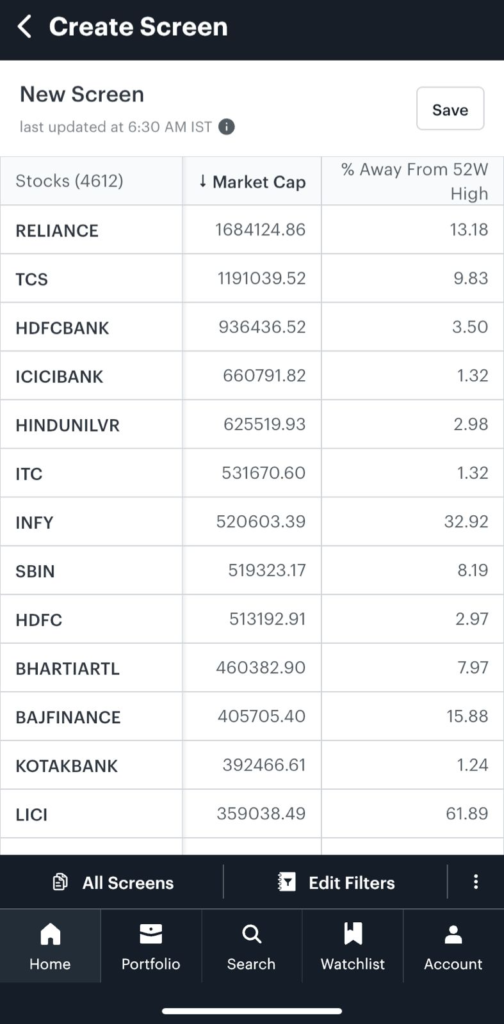
For example; To find the % Away From 52W High on Tickertape, click the stock you want to find the percentage difference for. The stock widget will give you the exact number to determine the % Away From 52W High. Similarly, to find the % Away From 52W High for a list of stocks, you can apply the filter on the stock screener.
Stock Widget
The stock screener page with the applied filter can get a % Away From 52W High.
Debt to Equity
Debt to Equity (D/E) is a financial ratio that compares a company’s total debt to its shareholders’ equity. It is a measure of the company’s financial leverage and indicates the proportion of debt financing relative to equity financing.
The formula for calculating the Debt to Equity ratio is as follows:
Debt to Equity = Total Debt / Shareholders’ Equity
- Total Debt: This includes all the company’s outstanding debt obligations, such as long-term loans, bonds, and other liabilities
- Shareholders’ Equity: This represents the residual interest in the assets of the company after deducting liabilities. It consists of the company’s retained earnings and capital contributed by shareholders
The debt-to-equity ratio is calculated by dividing total debt by total shareholder equity, which is 0.4%.
This ratio suggests that ITC has a very low level of debt relative to its equity. It indicates that the company primarily relies on equity financing rather than debt financing to support its operations and investments.
A lower debt-to-equity ratio generally indicates a lower financial risk and a more conservative financial position. It suggests that the company has a stronger ability to cover its financial obligations and withstand financial downturns.
Alpha
Alpha refers to the % outperformance by funds over and above the performance of their benchmark.
It is a measure of outperformance and thus higher alpha represents a better performance keeping other factors constant.
For eg: Fund A’s returns are 12.5% vs its benchmark’s returns of 10%, which makes Alpha = 12.5% – 10% = 2.5%. Similarly, Fund B belongs to the same category as Fund A and has returns = 15% & thus an alpha of 5% representing outperformance over both its peer fund and its benchmark.
For example, SBI has an Alpha of 10.84, which means SBI’s return against Nifty 50 was 10.84% higher.
ROCE
ROCE, or Return on Capital Employed, is a financial ratio that measures the profitability and efficiency of a company’s capital investments. It assesses how effectively a company generates profits from the capital employed in its operations.
The formula to calculate ROCE is:
ROCE = (Operating Profit / Capital Employed) x 100
- Operating Profit: This is the profit a company earns from its core operations, typically calculated as revenue minus operating expenses before interest and taxes.
- Capital Employed: It represents the total capital invested in a company and is usually calculated as the sum of a company’s long-term debt and shareholders’ equity.
ROCE indicates the percentage return a company generates from its total capital employed. It helps investors and analysts evaluate a company’s ability to generate profits relative to the amount of capital invested in its operations.
This can indicate effective management, strong operational performance, and the ability to generate substantial profits from the capital employed.
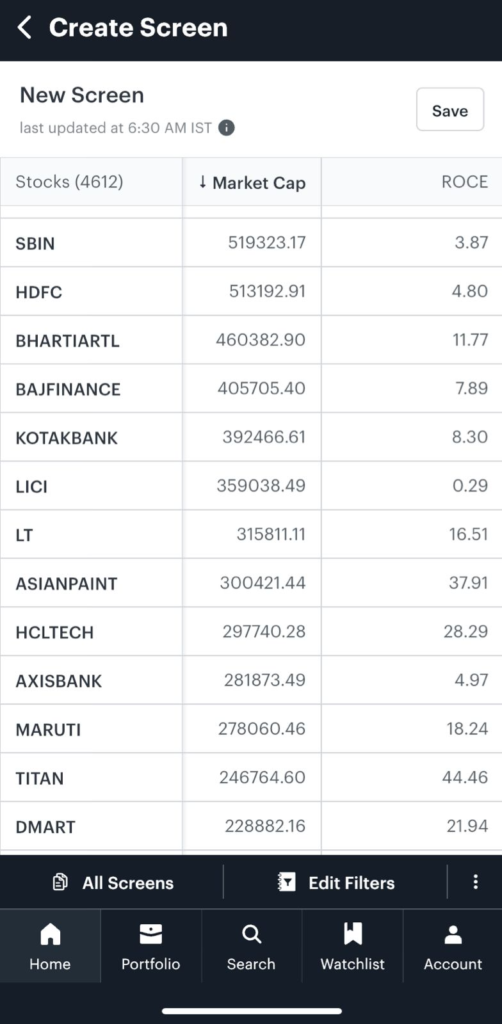
Conversely, a lower ROCE may indicate inefficiencies or challenges in utilizing capital effectively, resulting in a lower return on investment.
ROCE is commonly used as a benchmark to compare the performance of companies within the same industry or to assess a company’s performance over time.
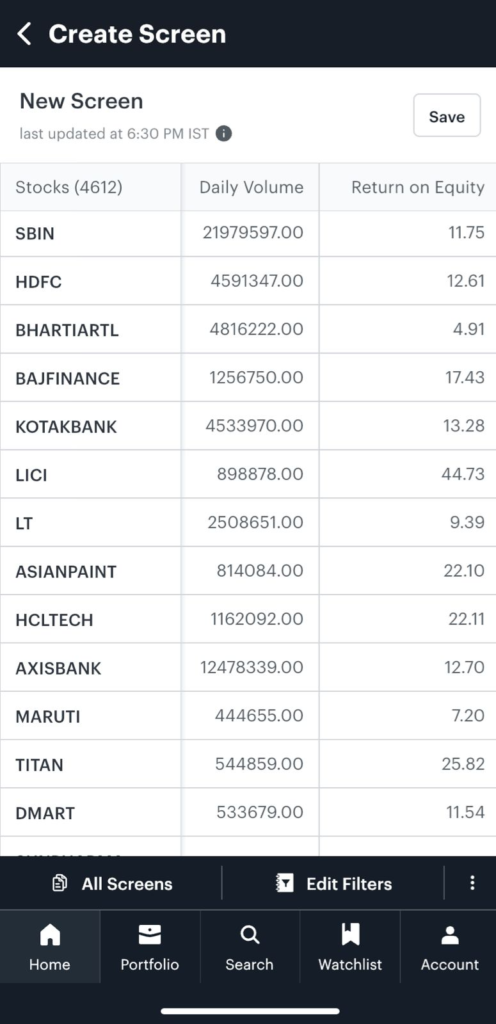
Daily Volume
Daily Volume refers to the total number of shares or contracts traded in a particular security or asset during a single trading day. It represents the level of activity and liquidity in the market for that particular asset on a given day.
The daily volume is calculated by adding up the number of shares or contracts bought and sold throughout the trading day. Each time a buyer and seller agree on a transaction and the trade is executed, it contributes to the daily volume.
Daily volume is an important metric for investors and traders as it provides insights into the level of interest and participation in a particular security.
5Y CAGR
5Y CAGR stands for 5-Year Compound Annual Growth Rate. It is a financial metric that measures the average annual growth rate of a quantity over a period of five years, assuming that the growth rate is compounded annually.
To calculate the 5Y CAGR, you need the initial value (starting point) and the final value (ending point) of the quantity you want to measure the growth of. The formula to calculate the 5Y CAGR is as follows:
5Y CAGR = (Ending Value / Starting Value) ^ (1/5) – 1
For example, in the case of Maruti Suzuki India Ltd, if we consider a specific metric, such as its revenue, and the 5Y CAGR is 0.85, it means that on average, Maruti’s revenue has grown by 0.85% annually over the past five years.
Return on Equity
Return on Equity (ROE) is a financial ratio that measures the profitability and efficiency of a company in generating profits from the equity invested by its shareholders. It indicates how effectively a company utilizes its shareholders’ equity to generate returns.
The formula to calculate Return on Equity is:
ROE = (Net Income / Shareholders’ Equity) x 100
- Net Income: This represents the profit earned by a company after deducting all expenses, including taxes and interest.
- Shareholders’ Equity: It represents the residual interest in the assets of the company after deducting liabilities. Shareholders’ equity includes the initial capital invested by shareholders and any retained earnings.
ROE provides insight into the company’s ability to generate profits relative to the amount of equity invested by shareholders.
For example; LICI stock has 44.73% ROE, a higher ROE indicates that a company is more efficient in generating profits using shareholders’ equity.
5Y Historical Revenue Growth
5Y Historical Revenue Growth refers to the average annual growth rate of a company’s revenue over a five-year period. It measures the rate at which a company’s revenue has increased or decreased on average each year during that period.
To calculate the 5Y Historical Revenue Growth, you need the revenue figures for the starting year and the ending year of the five-year period. The formula to calculate the growth rate is as follows:
5Y Historical Revenue Growth = [(Ending Revenue / Starting Revenue)^(1/5)] – 1
To save yourself from doing the research and figuring out the revenue of the company, use Tickertape’s 5Y Historical Revenue Growth filter.
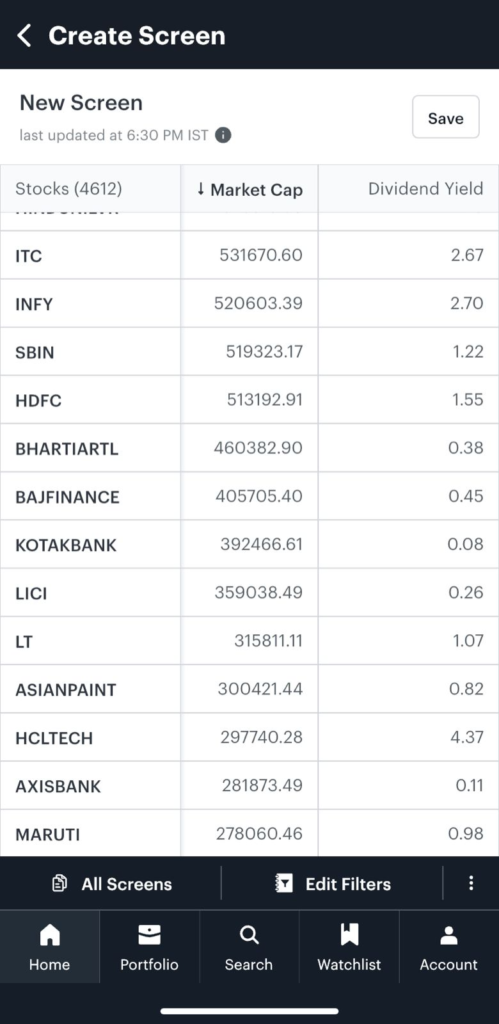
Dividend Yield
The dividend yield is a financial ratio that measures the annual dividend income generated by an investment relative to its market price. It indicates the percentage return an investor can expect to receive from dividends alone, without considering any potential capital appreciation.
The formula to calculate dividend yield is as follows:
Dividend Yield = (Annual Dividend per Share / Market Price per Share) x 100
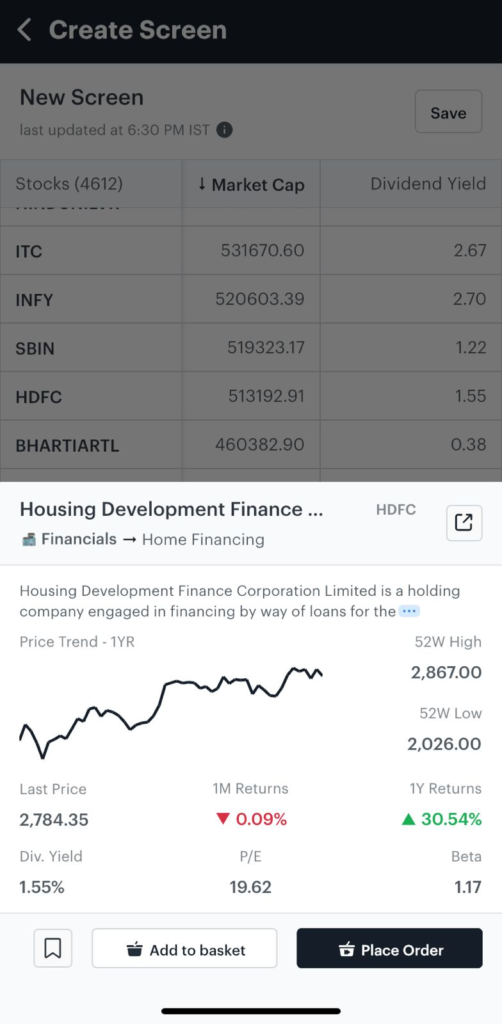
For example, taking HDFC stock;
Annual Dividend per Share = (1.55 / 100) x ₹2,784.35
Annual Dividend per Share ≈ ₹43.13
Therefore, based on the given dividend yield of 1.55% and the market price of ₹2,784.35, the estimated annual dividend per share for HDFC stock would be approximate ₹43.13.
Please note: Stocks prices are subject to change
You can also view Dividend Yield on the Stock widget
How to use these filters?
Step 1: Open the Tickertape app, and then the Stock Screener feature
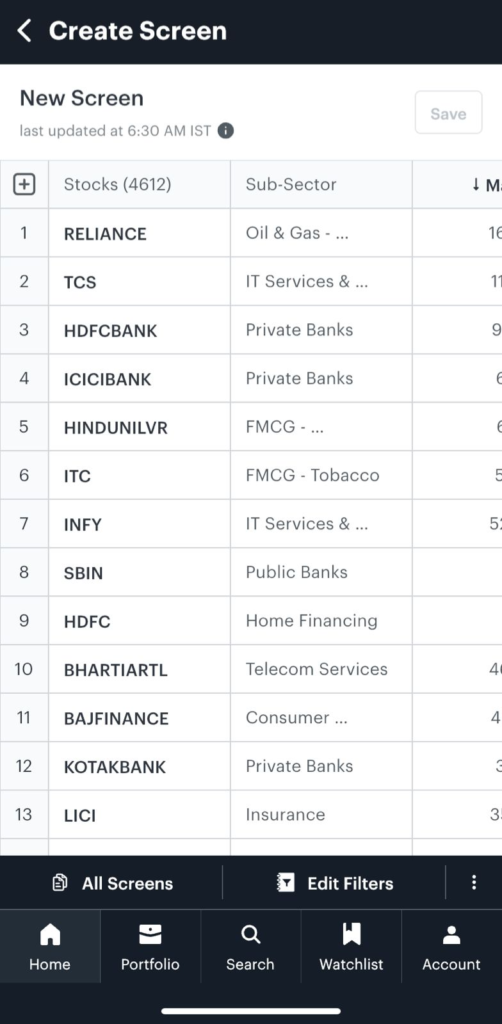
Step 2: Click on Create Screen to add/ remove filters

Step 3: Add filters, for example; Beta
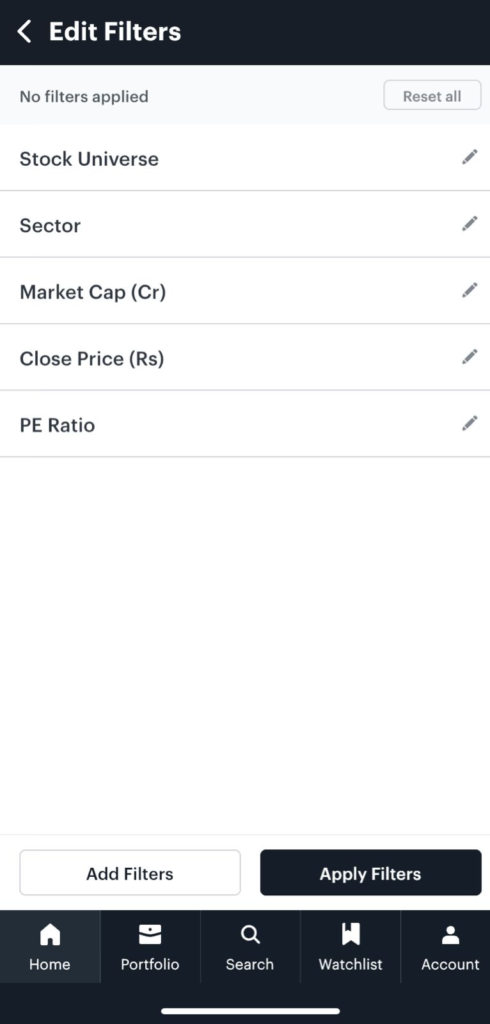
Step 4: Search for the filters you want to add to your screen

Step 5: After applying filters, you can view the stock screen.
In conclusion, Tickertape’s comprehensive set of filters empowers investors like you to navigate the complex world of investing with ease and confidence. By leveraging these top 10 filters, you can refine your investment choices and focus on opportunities that align with your specific criteria. Whether you’re interested in financial ratios, growth metrics, valuation parameters, or risk indicators, Tickertape has you covered. With the ability to customise and fine-tune your search, you can make informed investment decisions that suit your investment strategy and goals.

- Scheduled Orders - May 5, 2026
- What is Loan Against Securities (LAS)? - Mar 30, 2026
- Akshaya Tritiya’26 on Tickertape – Terms and Conditions - Mar 24, 2026


