

Last Updated on Apr 26, 2022 by Aradhana Gotur
This article is authored by Kunal Rambhia, a fund manager at The Streets, a private fund. He has been in the equity market since 2010, performing various roles such as Associate Research Analyst, Research Analyst, and Associate Portfolio Manager. He has media appearances with CNBC and ET NOW. Kunal is also a visiting faculty in multiple colleges.
The year 2020-21 witnessed a pivotal moment for the online shopping segment as more and more customers became habituated due to its comfort and convenience. This article will analyse my technical views on India’s largest online B2B marketplace – IndiaMART, which has experienced a ~50% drop since its run-up. The counter appears to be forming a base and is available for purchase at a bargain.
Let’s go through all technical observations on different timeframes.
Table of Contents
Weekly: Price action, Trendlines and Fibonacci retracement
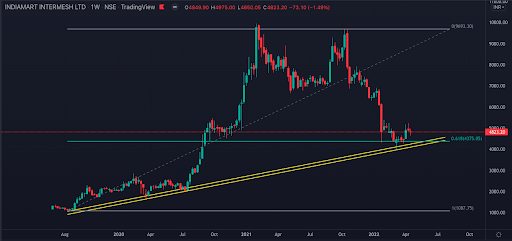
A steady run-up until 2021 and a sizable decline are witnessed on the counter. But the trend has remained intact since the inception of the counter, which is highlighted with a yellow trendline. The retracement of the entire advance is taken to understand the size of correction. Price halted in the vicinity of 61.8% (golden ratio), which is considered a healthy correction. The double top was witnessed during 2021, for which the target on the lower side was expected to be 4,000. That target is clearly achieved, which gives the ray of hope for a limited downside. Keeping all things in mind, one can expect consolidation near the support area.
Weekly: RSI divergence
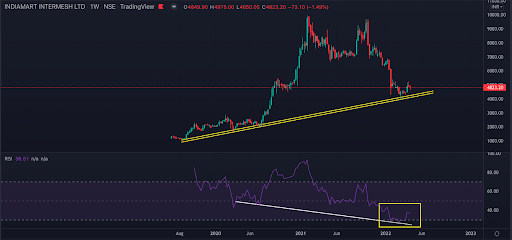
Since its inception, the price has been in advance mode. But RSI (Relative Strength Index) kept on making lower bottoms and is holding the trendline well (highlighted with white trendline). This is perfectly forming a bullish hidden divergence. Recently, RSI bounced right from the support, making higher top higher bottom so far, and the price has also taken support on the yellow trendline.
Weekly: MACD
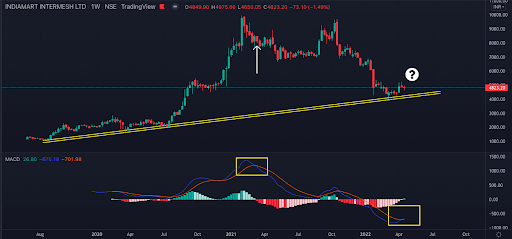
MACD (Moving Average Convergence Divergence Indicator) is a lagging indicator, and there are several triggers on the same needle. Highlighted with a yellow box, when the price declined after the 10,000 mark, MACD crossover was witnessed. That zone was the highest zone on MACD recorded so far. The decline continued for a pretty long time, and extremely low levels were witnessed on MACD. Finally, when the price reached near support and entered a bit of consolidation, MACD confirmed crossover. As a result, we’re prompted to remain hopeful for a quick turnaround.
Daily: MACD
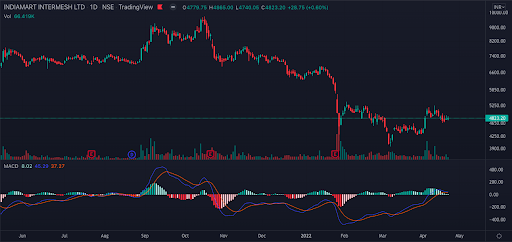
Since February 2022, the price remained in sideways consolidation with good volume support. MACD, from extreme lows, showed positive divergence, crossover, zero line crossover and inching higher, confirming that a solid uptrend is likely to emerge soon.
Daily: Supertrend
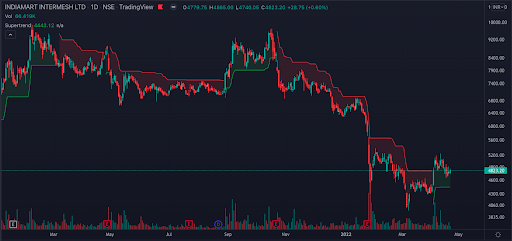
Since November 2021, the price has remained in a downtrend. The most recent uptick in price action confirmed a Supertrend breakout, giving a ray of hope for the beginning of a fresh uptrend.
Daily: Bollinger bands
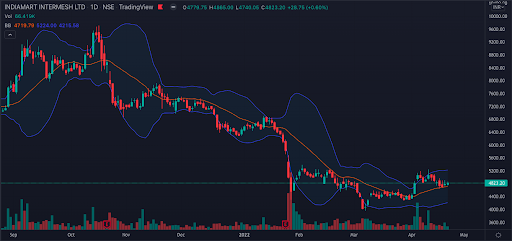
Bollinger band, in itself, is a complete positional trading indicator package. Very clearly visible that 20 SMA of BB is acting as an apparent resistance most of the time in a downtrend. From extreme low, when price witnessed a decent bounce with good volumes, it crossed the upper band of Bollinger. 20 SMA started offering support to the price action, which is a positive sign, and one can take a clue from this support to initiate longs.
Daily: Price pattern with RSI
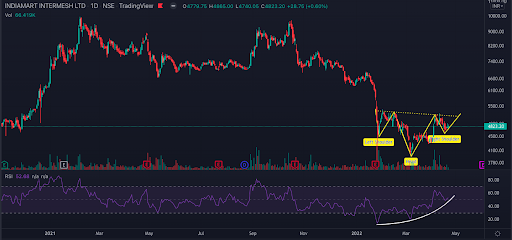
If bottom formation comes with any pattern, then the reliability of the bottom formation turns high. After a steep decline, the price went into a sideways consolidation. The sideways phase coincided with a bullish RSI divergence. The price action formed Inverse Head and Shoulder formation, which is a highly reliable pattern. Every uptick in the price within the formation is supported by higher volumes. Presently the pattern is “still” unfolding and nearing the bottom of the right shoulder. Though risky (because of anticipation of pattern), it offers a bargain buying opportunity. One can keep an eye on the pattern’s breakout to capture “momentum” on the counter.
Putting it all together
The weekly chart’s trendline support and 61.8% retracement zone, with hidden bullish RSI divergence and MACD crossover at the extreme low zone. The daily chart hints at three positive signals from MACD, Supertrend crossover, Bollinger Band crossover and support. Additionally, the most appealing inverse head and shoulder formation with a bullish RSI divergence with volume support make IndiaMART an appealing bet with minimal downside and massive upside potential.
Statutory Disclosure: Kindly note that this update is only for educational purposes. It is safe to assume that my personal position, fund’s position, client’s position, and relative’s position may be open on the counter. Prefer to take the advice of your financial advisor before initiating any position.

- Avenue Supermarts: Is Dmart Providing Shopping Opportunities for Portfolios? - Mar 29, 2023
- GMR Airport Infra: Counter on Runway To Fly Soon! - Mar 21, 2023
- SW Solar: Is The Counter A Good Bet From Long-Term Perspective? - Mar 14, 2023

