

Last Updated on Mar 21, 2023 by
Uncertainty in the market continues, and every day there are new developments across the financial markets worldwide. In spite of all negatives around, many counters show good formations and are worth keeping an eye on. One such counter is GMR Infra (the new name is GMR Airport Infra). In this article, let’s look at all the different time frame charts to understand the structure of GMR Infra.
Table of Contents
Monthly: Price action
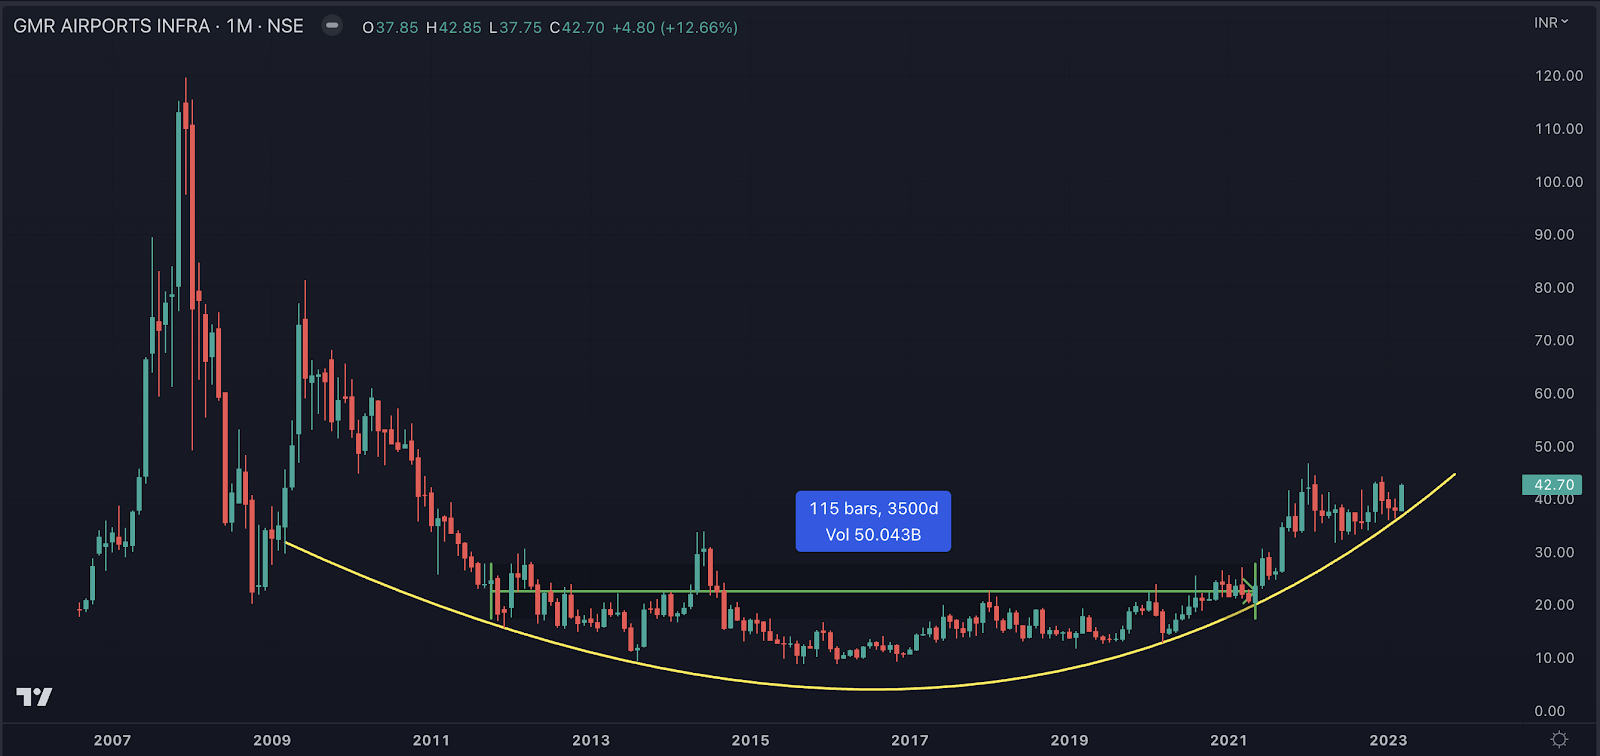
One of the favourite hot counters of the 2007 rally, GMR Infra, fell massively and never recovered till recent times. It actually entered into broader consolidation of almost 10 yrs. This broader curve formation will give enough accumulation opportunities going forward.
Monthly: Price action and formation
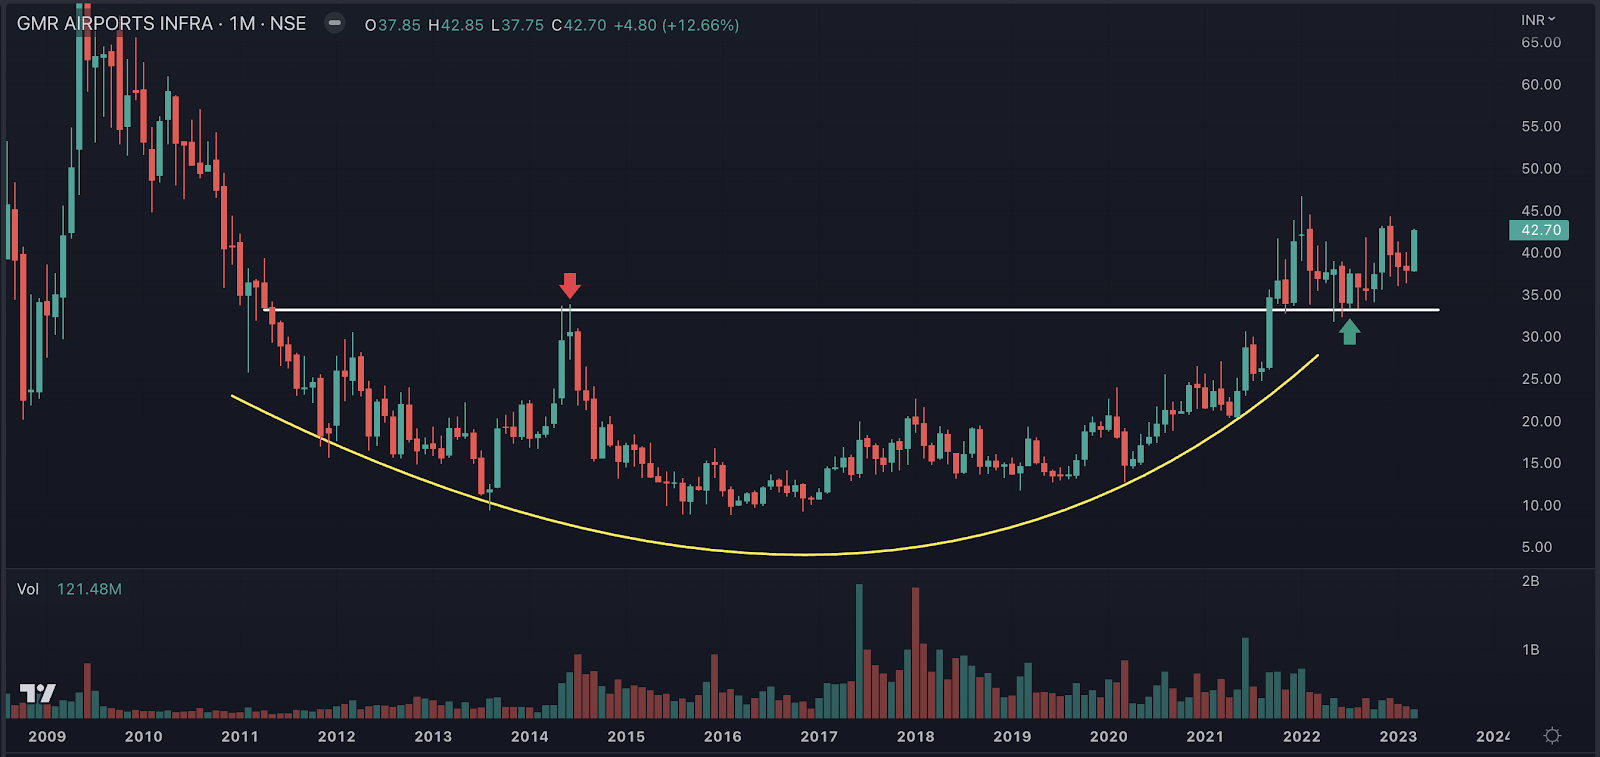
This is a zoomed monthly chart. We can clearly see higher volumes near the bottom and volumes on sizable upticks. Price came out of 10 yrs of consolidation decisively and retested the same zone. After retesting the zone, now it reclaimed the highs again. A clear higher top higher bottom is making the counter fly anytime soon.
Weekly: Trendlines

From the bottom of 2020, the counter is making its perfect higher bottoms and well-respecting white trendline. 2022 – 2023 was a sideways phase of the counter, where we could see 2 curves, different in sizes, forming cup and handle formation. Lower tops are also noticed from the recent peak, which highlights a symmetrical triangle formation. One can accumulate counters either on the cup and handle or symmetrical triangle breakout or on the support of a white trendline and ride the rally.
Weekly: RSI
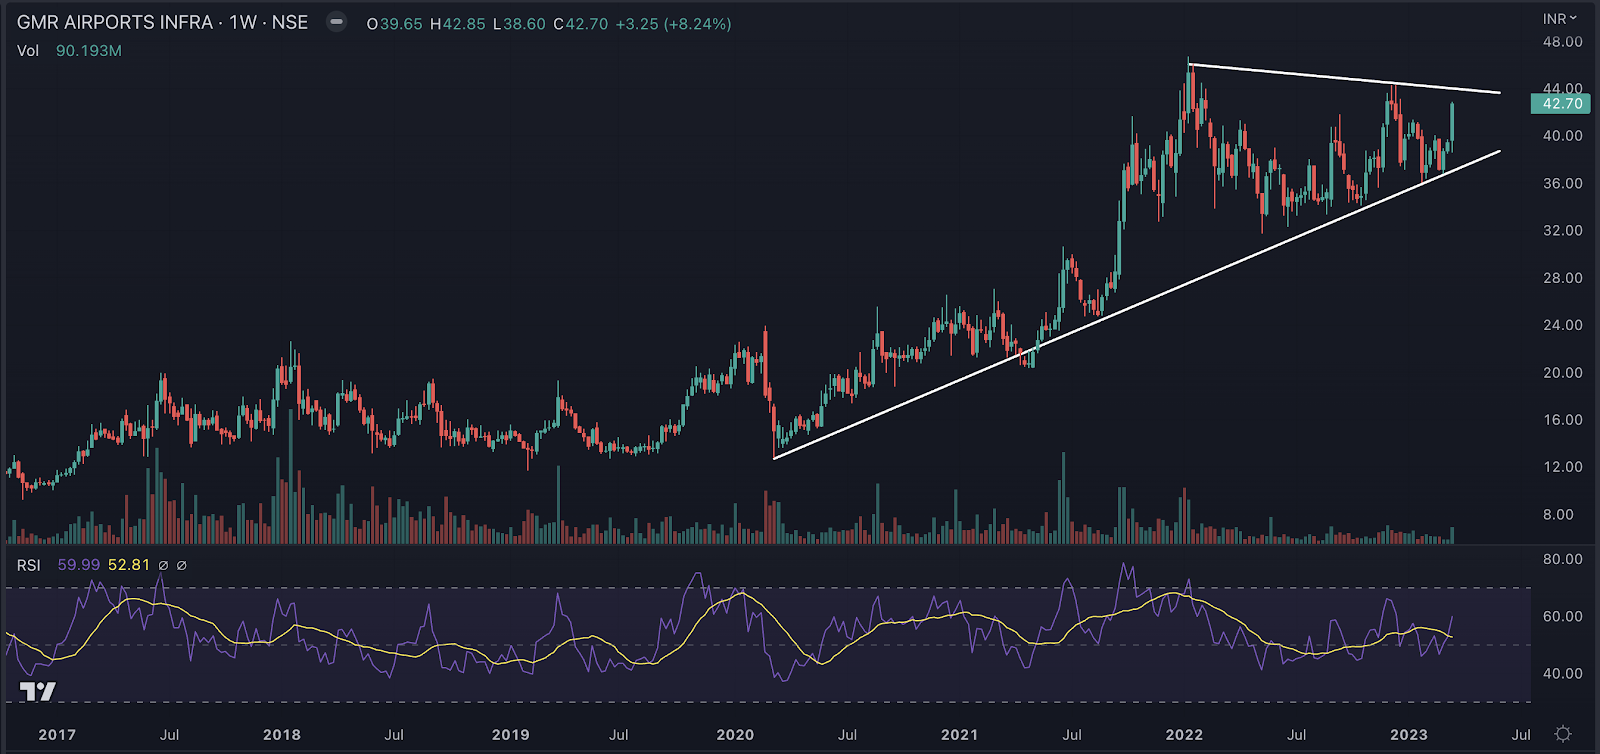
Since the counter entered the consolidation phase post-positive rally, RSI is hovering near and above the 50 zones, confirming good strength. The last week turned bullish for the counter, where RSI bounced from the zone and now pointing upward, confirming the ongoing momentum. Again, if the counter comes near support, it could be the best opportunity to accumulate or buy on the breakout.
Weekly: MACD

MACD (Moving Average Convergence/Divergence) is a lagging indicator. As I regularly share, there are multiple ways of looking at MACD. Presently, MACD is above the zero line, which confirms the trend is positive. The recent lackluster behavior on the counter has pushed MACD near the zero line. Now, it is reversing from the same zero line with a crossover, confirming the possibility of a new rally within the main rally.
Weekly: Ichimoku
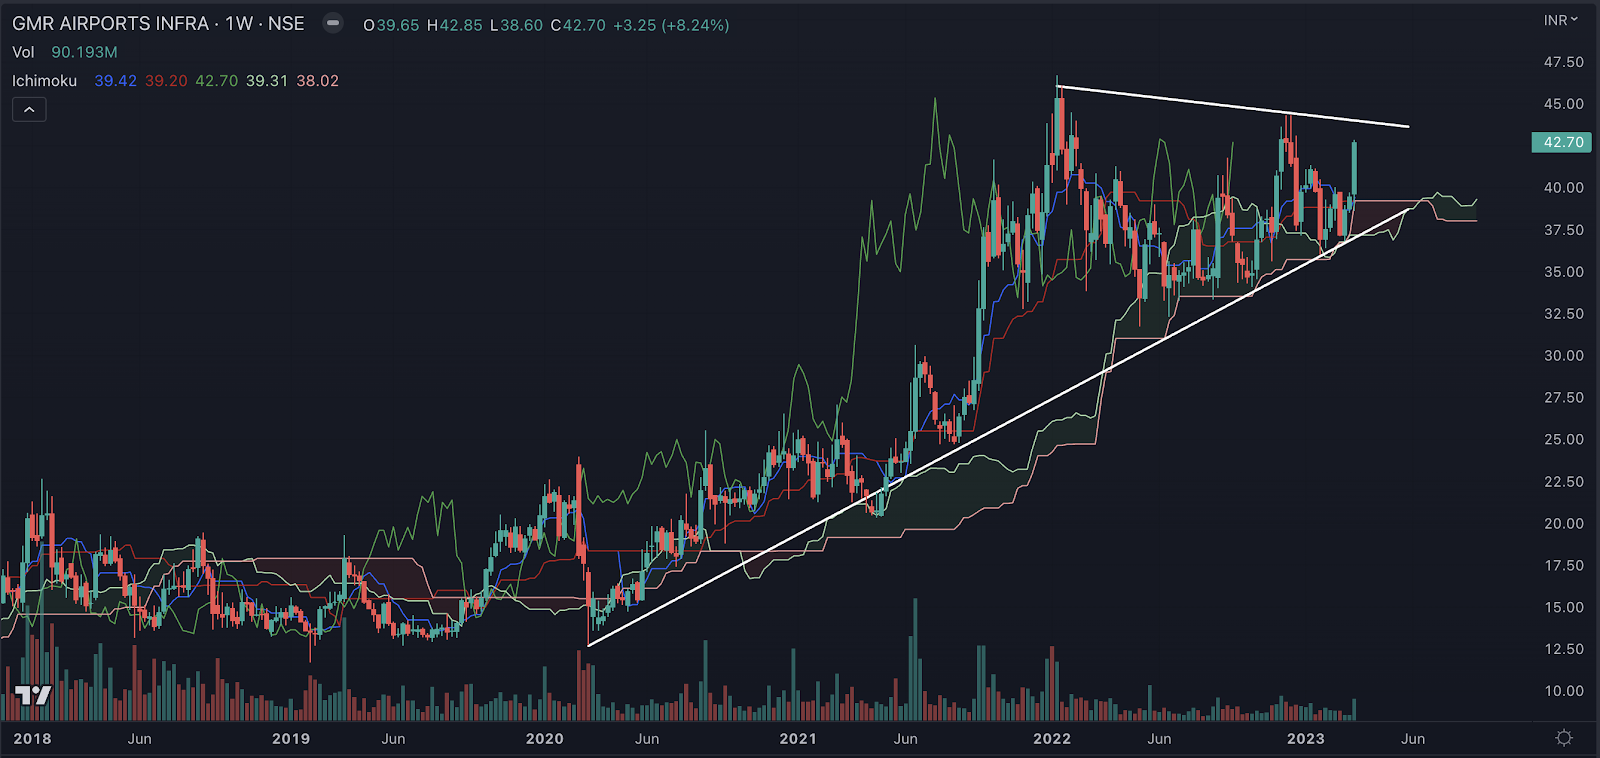
Ichimoku is an equilibrium indicator that helps understand a broader counter perspective. This indicator can be used by splitting the same and also as a whole. We can see that Chikou’s span is in the open sky, Tenkan – Kijun is holding their bullish crossover, the future Kumo cloud is bullish, and Senkou Span A is pointing upward; all observations are confirming bullishness in counter. It seems a perfect buy on the dip counter.
Weekly: Supertrend

From the lows of 2020, when the counter entered an uptrend, the super trend’s decisive breakout was noticed. Since then, whenever the counter came lower to make the higher bottom, the super trend offered constant support. For positional traders, this indicator can offer the perfect bargain-buying opportunity.
Weekly: Exponential Moving Average
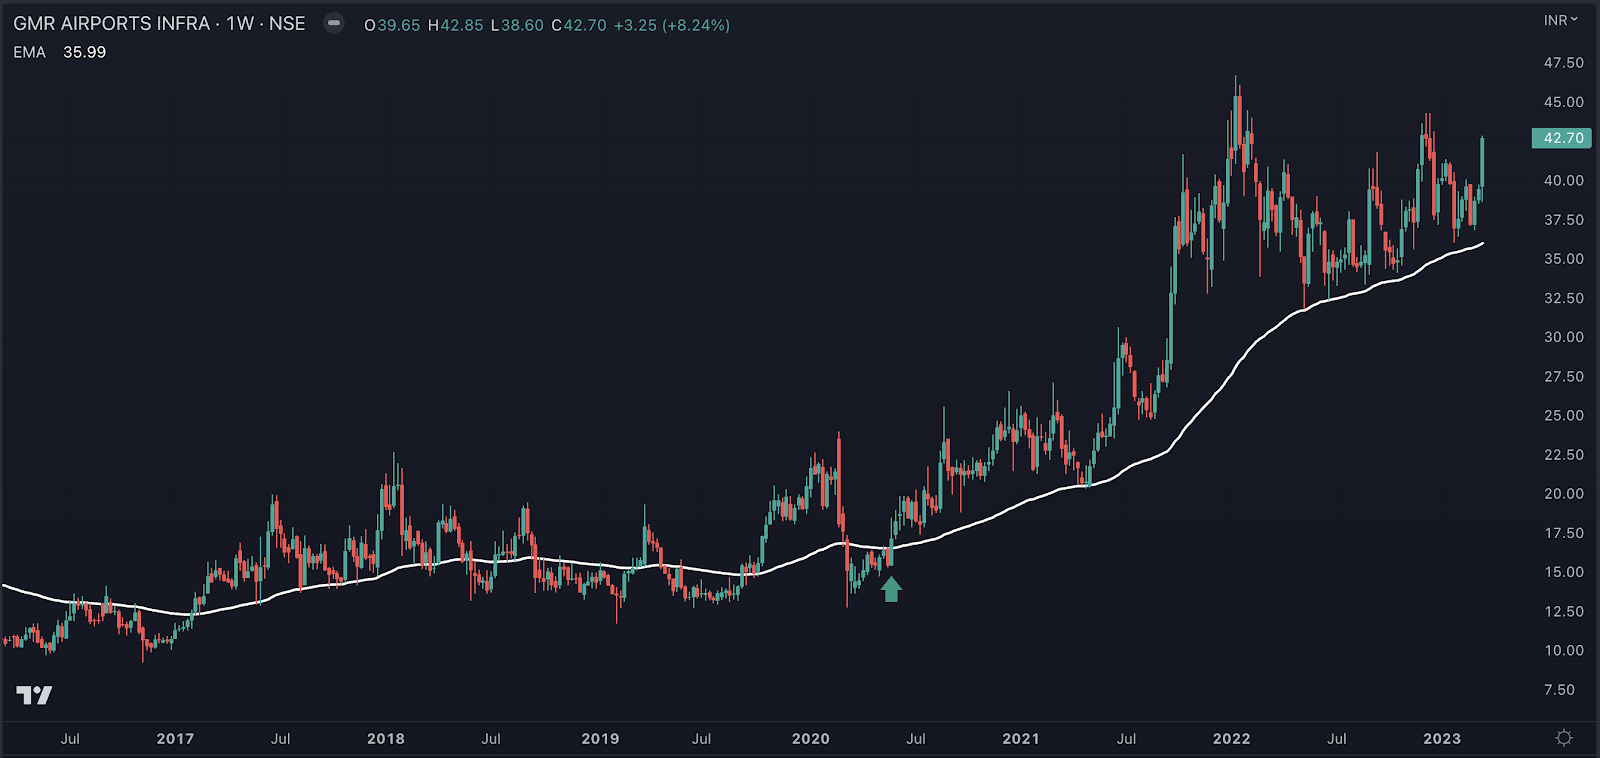
Moving average is a simple technical tool for trading and investing. Moving averages can be used for breakout/breakdown signals. But the effectiveness of the same is seen when applied after a bit of trial and error. Here on the chart, the 80-period moving average has offered fantastic support/since the 2020 breakout. Just like the Supertrend, the moving average can also accumulate counter from the long-term perspective.
Putting it all together
Looking at a long-term consolidation breakout of 10 yrs, with stronger RSI, positive MACD, super positive Ichimoku, super trend, and moving average continuation along with symmetrical triangle and cup and handle formation is making this counter very attractive from a mid to long-term perspective. One can either accumulate on a breakout or buy near support with risk management in place.
Statutory disclosure: Kindly note that this update is only for educational purposes. It is safe to assume that my personal position, my fund’s position, my client’s position, and my relative’s position may be open at the counter. Prefer to take the advice of your financial advisor before initiating any position.

- Avenue Supermarts: Is Dmart Providing Shopping Opportunities for Portfolios? - Mar 29, 2023
- GMR Airport Infra: Counter on Runway To Fly Soon! - Mar 21, 2023
- SW Solar: Is The Counter A Good Bet From Long-Term Perspective? - Mar 14, 2023


