

Last Updated on May 17, 2022 by Anjali Chourasiya
Kunal is a fund manager at The Streets, a private fund. He has been in the equity market since 2010, performing various roles such as Associate Research Analyst, Research Analyst, and Associate Portfolio Manager. He has media appearances with CNBC and ET NOW. Kunal is also a visiting faculty in multiple colleges.
Sizeable correction offers decent entries in the counters with the best risk-reward ratio. As a market participant, I always prefer to focus on the risk-reward ratio, which can help grab positional trades with minimum risk on the lower side. Here is one such opportunity in Reliance Industries based on “technical analysis”.
Table of Contents
Weekly: Price action
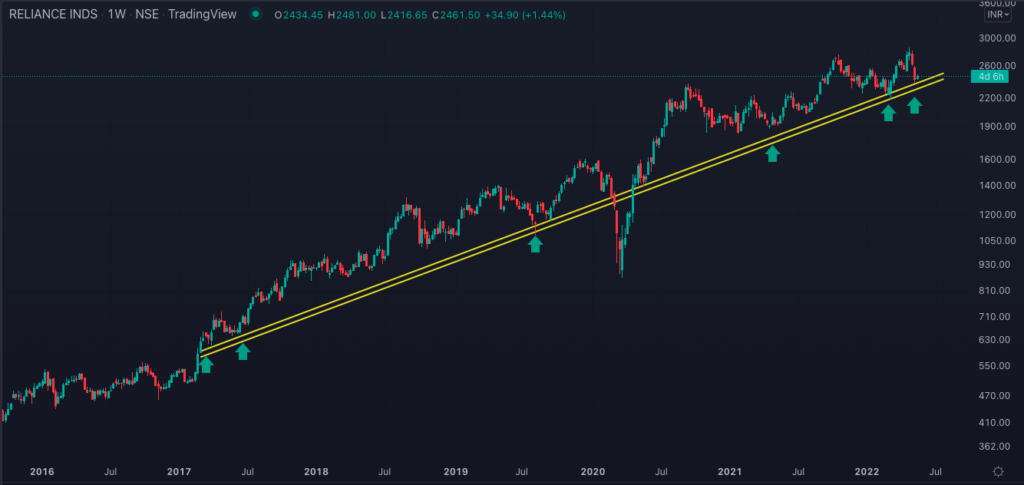
This weekly chart of Reliance has data from 2017. A decisive trendline has been offering support to the counter since then. Certainly, it got violated during 2020, but prices were reclaimed soon and the trendline continued offering support again. In the previous week, low tested the same support line again and bounced from that zone, making it a shortlisting-worthy candidate.
Weekly trendlines
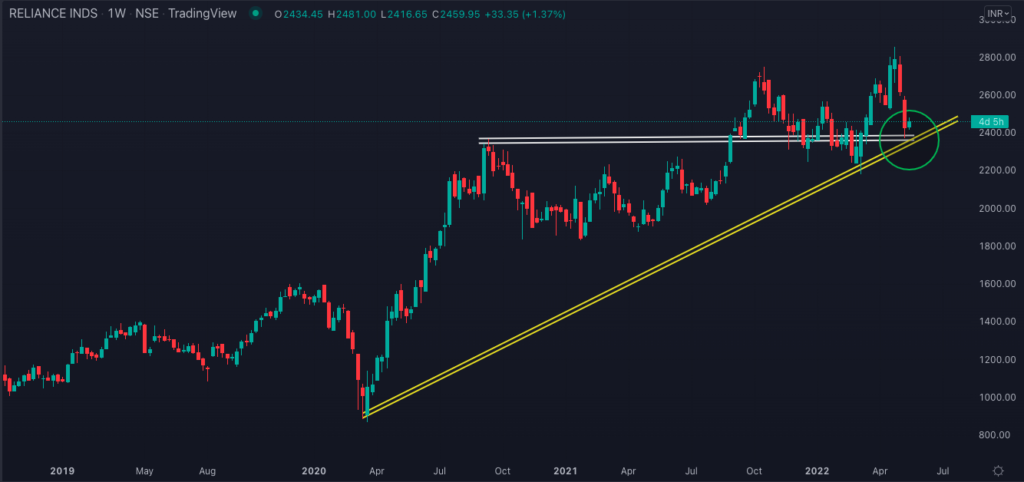
One more observation on the zoomed weekly chart is that the counter has taken support at the yellow trendline, which is made by connecting the bottoms of 2020 and recent correction. The beauty of the support zone is that it is coinciding with the horizontal support zone created by connecting August 2020 high. That zone (highlighted with a white line) has played a change in polarity role multiple times in the span of 18 months. The 2400 zone seems a perfect “inflection point” and thus worth eyeing to create longs.
Weekly Ichimoku
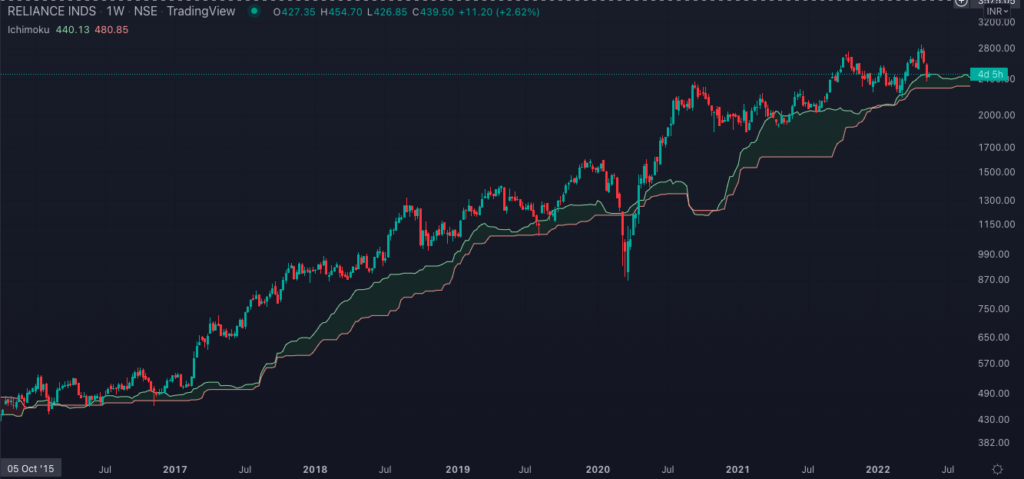
Ichimoku is a trending (lagging) indicator and confirms the trend late. Considering corrections on the counter, there is no point in looking at Tenkan Sen and Kijun Sen. My focus is on Kumo Cloud. Again, we go back to historical data on the chart, Kumo Cloud has offered support multiple times in the past. Presently price has bounced from the Kumo Cloud zone itself. Also, the trendline support cluster is in the same zone, which is giving more conviction about the potential reversal from the present zone.
Daily chart: Relative Strength Index (RSI) and Fibonacci
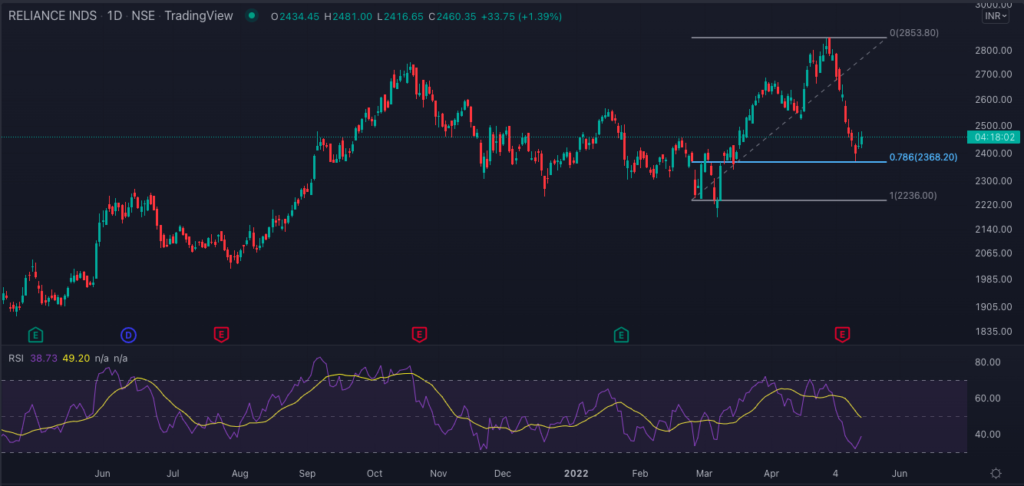
After the most recent decline, a ray of hope came from the previous cluster of candles where a hammer (kind of) formation was seen. This zone turned out to be 78.6% of the retracement zone for the last advance. Multiple times, RSI has bounced from the oversold line (placed at 30) and the bounce is coming from 78.6% retracement alongside the RSI bouncing from the zone of 30. Certainly, the best risk-reward to initiate longs!
Daily chart: 200 Period Exponential Moving Average
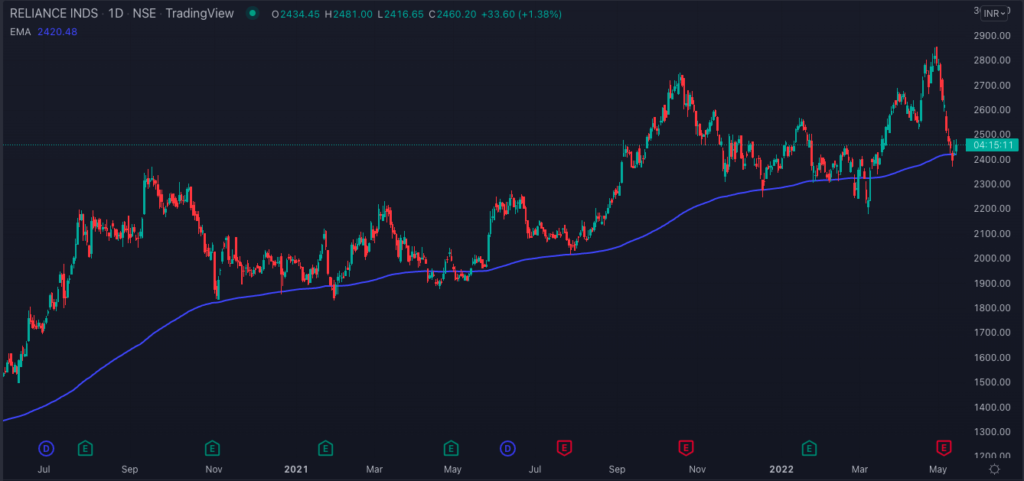
A simple trend following indicator is the moving average, and one of the simplest is the 200 period EMA. One shouldn’t consider the exact level of the moving average, rather consider the zone. On the daily chart, we can see support being offered by 200 EMA almost 10 times and we have seen a good bounce even this time from the same zone. Stay bullish, stay confident 🙂
Ratio chart: Reliance and Nifty
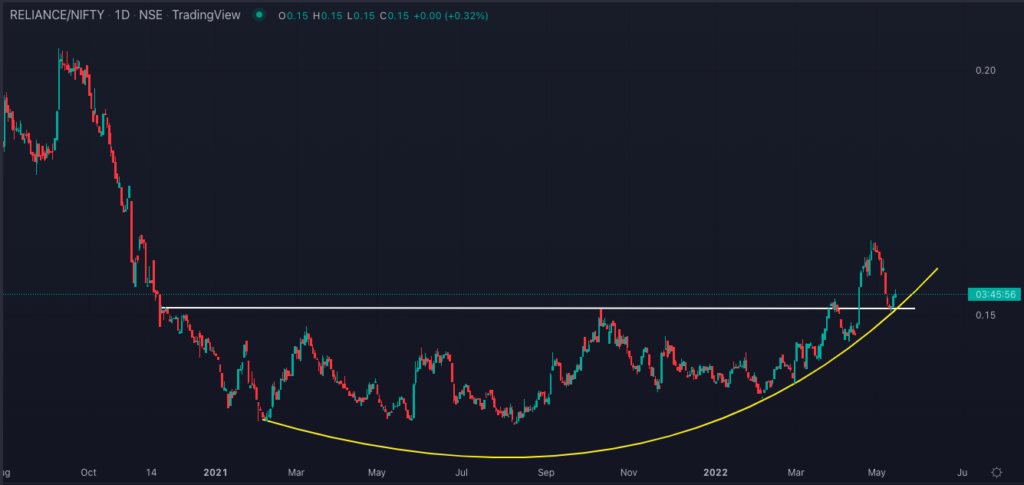
A perfect curve formation is noticed on the ratio chart of Reliance and Nifty. Also, the most recent breakout on the chart is perfectly retested (highlighted with a white trendline). The ratio chart is pointing upward, which confirms Reliance’s outperformance over Nifty in the time to come.
Putting it all together
Looking at weekly trendlines from a positional and near-term perspective, Ichimoku Kumo Cloud support on a weekly chart, 78.6% Fibonacci support on a daily chart, reversing RSI from 30 zone and 200 EMA support on the daily chart, are all supporting bullish view from the present zone. The ratio chart of Reliance and Nifty is highlighting a likely outperformance of Reliance in the time to come.
Statutory Disclosure: Kindly note that this update is only for educational purposes. It is safe to assume that my personal position, my fund’s position, my client’s position and my relative’s position may be open on the counter. Prefer to take the advice of your financial advisor before initiating any position.

- Avenue Supermarts: Is Dmart Providing Shopping Opportunities for Portfolios? - Mar 29, 2023
- GMR Airport Infra: Counter on Runway To Fly Soon! - Mar 21, 2023
- SW Solar: Is The Counter A Good Bet From Long-Term Perspective? - Mar 14, 2023

