

Last Updated on Jun 5, 2025 by Aishika Banerjee
Buying low and selling high is considered the ultimate mantra for success in stock market investments. Everyone wishes to catch a stock when it’s bottoming out and sell it after it has scaled lofty heights. But how does one identify stocks that are undervalued? Or how do you judge if a stock is cheap or expensive? In this article, let’s understand ways to identify undervalued stocks using Tickertape.
Table of Contents
What are Undervalued Stocks?
Equity shares with a lower market value than their intrinsic or true value are called undervalued stocks. There can be many reasons behind this, ranging from sector-specific to market slowdown. The process of investing in undervalued stocks is known as value investing. This method is a key component of famed investor Warren Buffet’s investment strategy.
How to Analyse a Stock?
The stock market values companies based on their fundamentals, past financial performance, future earnings growth potential, and other metrics. The intrinsic value of a stock is calculated by looking at all these factors. A combination of quantitative and qualitative analysis is used to determine the intrinsic value of a stock.
How to Find Undervalued Stocks?
Here are some ways you can use to determine if a stock is undervalued.
Analyse financial statements
There are three important statements that every investor should be aware of when selecting undervalued stocks india. The good news is you can check all of them under one section on Tickertape. More on that later; let’s first understand the three important statements.
- Balance sheet analysis
The balance sheet of a company lists its assets and liabilities. This approach helps an investor determine whether a stock is undervalued by taking into account the size and activity of the asset and liability side of the balance sheet.
- Cash-flow analysis
A glance at a company’s cash flow will tell you exactly how much revenue a business generates from operations compared to the expenditure. By taking into account the cash flow from operations and investing activities, an investor can determine whether a stock is undervalued or not.
- Profit and loss statement analysis
A company’s profit and loss statement provides insight into its financial performance over a given period. By taking into account revenue, operating expenses, and net profit margin, an investor can determine whether a stock is undervalued or not. If the operating margin and the net profit margin are healthy and the stock valuation is not in accordance, then it can be considered undervalued.
You can assess a company’s profitability, liquidity, debt levels, and overall financial stability. This analysis helps identify undervalued large-cap stocks and undervalued small-cap stocks by comparing the company’s financial metrics to its market value. By identifying discrepancies between a company’s intrinsic value and its current market price, investors can uncover opportunities to invest in stocks that may be undervalued and have the potential for future growth.
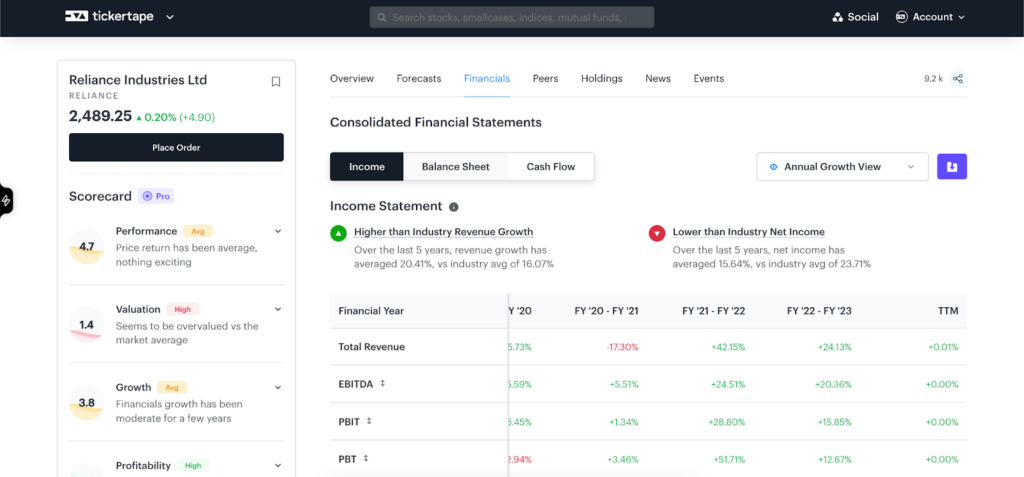
To get all these statements on Tickertape, follow the below-mentioned steps.Step 1: Search for any company on Tickertape.
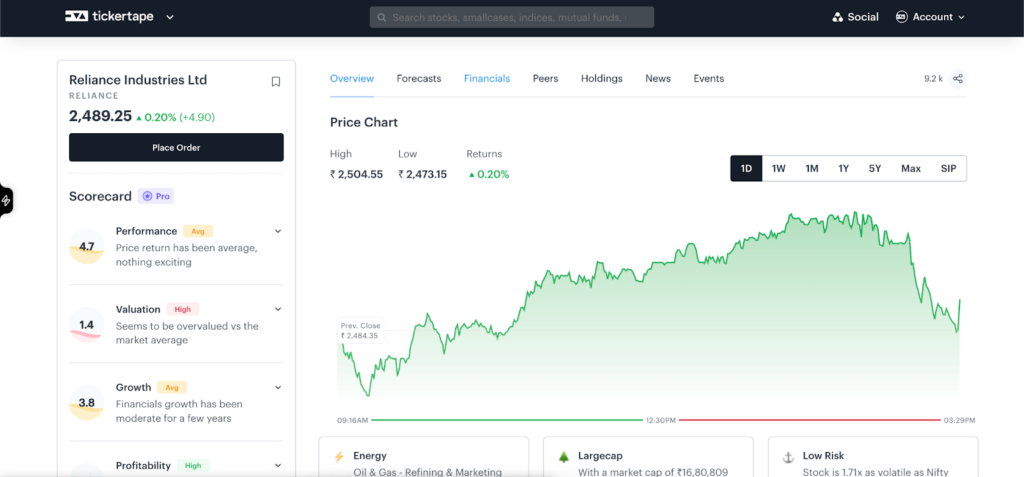
For this example, let’s search for Reliance Industries Ltd.

Step 2: From the stock ‘Overview’ page, click on ‘Financials’.
Step 3: There you go! You get all three crucial statements under one umbrella.
Relative valuation
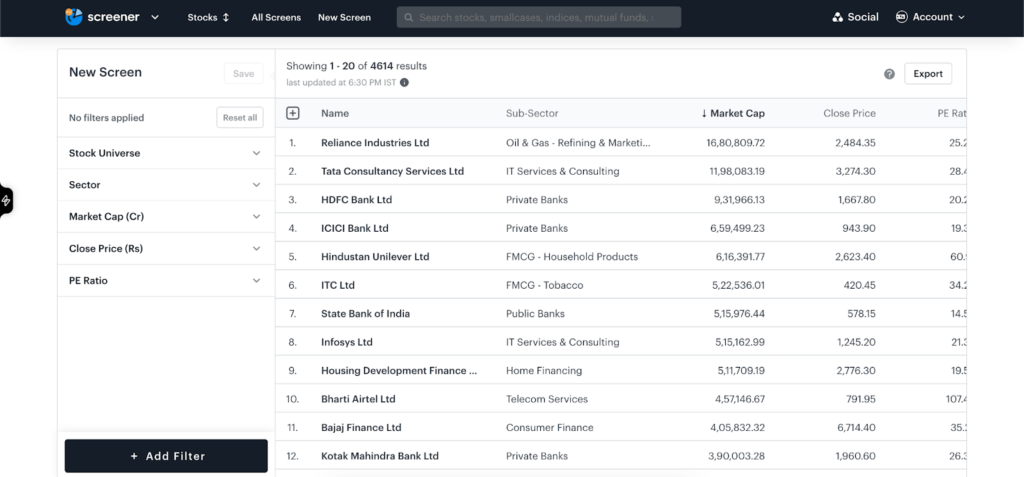
This is a qualitative valuation technique where companies are compared against their peers. It basically follows identifying a peer set and then using appropriate ratios and numerals to gauge the relative stand of the company in the market. You can get all the information you need on Tickertape Stock Screener. Use over 200+ filters to get the list based on metrics as per your preference. In case you can’t find a filter, you can create one using custom filters. For example, if we wish to identify undervalued stock in the multiplex industry, we can use the price-to-sales ratio to see which company is a better performer. Follow the below-mentioned steps to create a custom filter.
Step 1: Go to Tickertape Stock Screener.
Step 2: Click on ‘+Add Filter’ and then click on ‘Custom’ at the top of all filters.
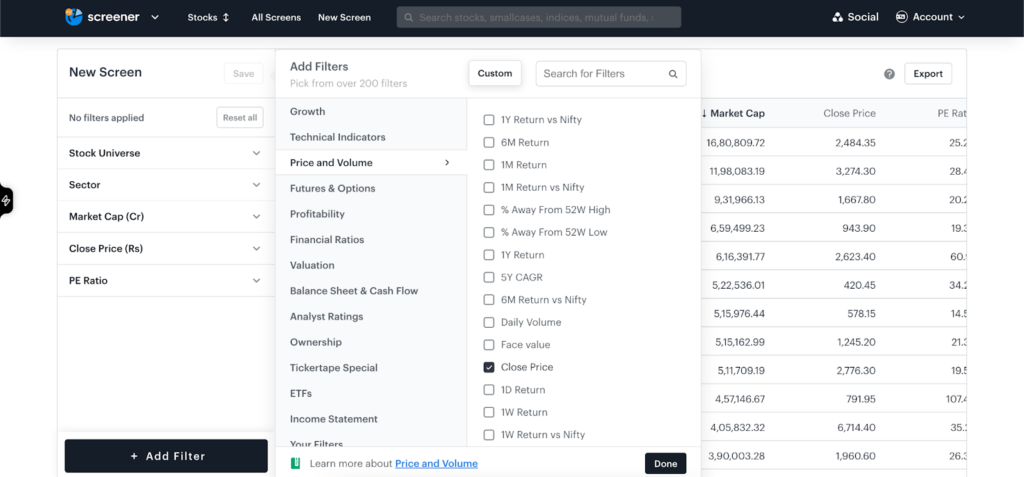
Step 3: A pop-up window will appear where you can put the formula for creating your custom filter or use one from examples from ‘See Examples’.
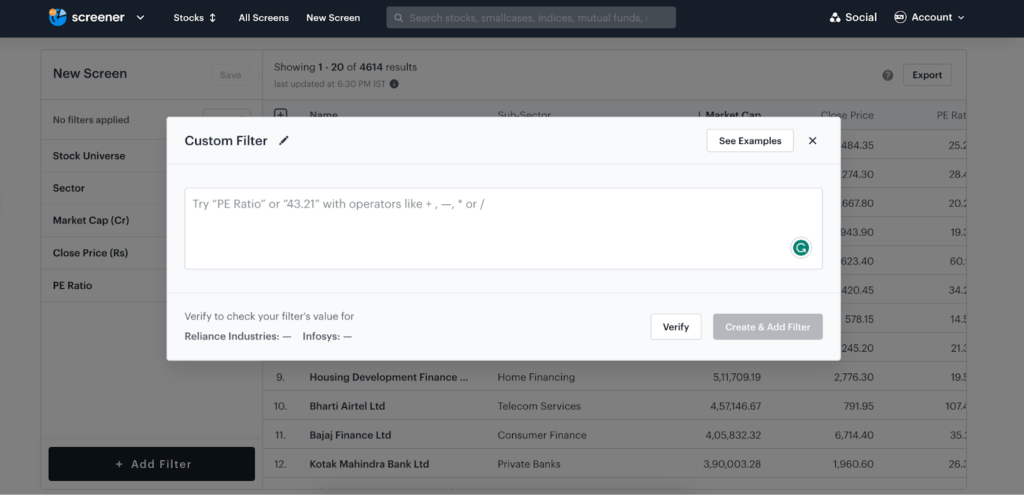
There you go! Your custom filter is created and saved for future use. Using the available or custom-built filters, you can list the stocks below their intrinsic values and analyse them further.
Evaluation via financial ratios
Financial ratios are an excellent and time-saving method of evaluating the value of a stock. It helps in company analysis, performance valuation, and predicting the stock’s future. Most of these numbers are readily available and can be used to find the true value of a stock. Before we dive into how you can use Tickertape to identify stocks below their intrinsic value, let’s look at some crucial financial ratios.
- Price-to-Earnings Ratio (P/E)
The P/E ratio arguably is the most important financial ratio to help determine if a stock is undervalued or even overvalued. It gives the price that investors are ready to pay for each unit of profit. It is given by the formula:
P/E ratio = Current Market Price/Earnings Per Share
If the P/E ratio of low P/E stocks is less than 15, then analysts usually consider the stock undervalued. A lower P/E ratio indicates that investors are willing to accept a lower return from the stock in exchange for holding on to it. A low P/E ratio could also indicate the stock is unpopular and yet to be discovered by markets.
- Price-to-Book Ratio (PB Ratio)
Investors glance at this ratio to assess a firm’s market capitalisation compared to its book value. It is given by the formula:
P/B Ratio = Market price per share/Book value per share
A lower P/B ratio in low P/B ratio stocks means that the market is valuing a company’s book value lower than its actual worth, indicating that it could be undervalued. For running companies, the P/B ratio should never be below book value.
- Return on Equity (ROE)
The return on equity ( ROE ) ratio is used to measure a company’s profitability by revealing how much profit it generates with the money shareholders have invested in its stock.
Return on equity = Net income/Average shareholder’s equity
If a company has a low P/B ratio clubbed with a high ROE, it usually is indicative of an undervalued stock.
- Return on Capital Employed (ROCE)
The return on capital employed (ROCE) ratio is used to measure a company’s performance by revealing how much profit it generates from its total assets.
ROCE = EBIT/Capital employed
If ROCE is more than the cost of capital, then it usually is considered undervalued.
- Price to Free Cash Flow Ratio (P/FCF)
Free Cash flow is the actual cash that a company has generated through its operations, kept as a reserve for future investment purposes.
P/FCF = Share Price/Free cash flow
Ideally, a company with a robust cash flow generates more income receivable month on month than what it pays out. An upward trend in this ratio indicates that an investor is paying a lower cost for an increased earning potential. The P/FCF can be used to measure undervaluation. If the ratio is less than 10, it can be considered undervalued.
Tickertape stock pages and Stock Screener shows you a deeper view of the stock and a detailed comparison of its peers. With over 200+ filters, you can enhance your search for undervalued or value stocks below their intrinsic value. Listed below are steps to apply filters to evaluate undervalued shares using financial ratios.
Step 1: Go to Tickertape Stock Screener.
Step 2: Click on ‘+ Add Filter’ and look for ‘Financial Ratios’. You can search for the ratios which you can’t find here.
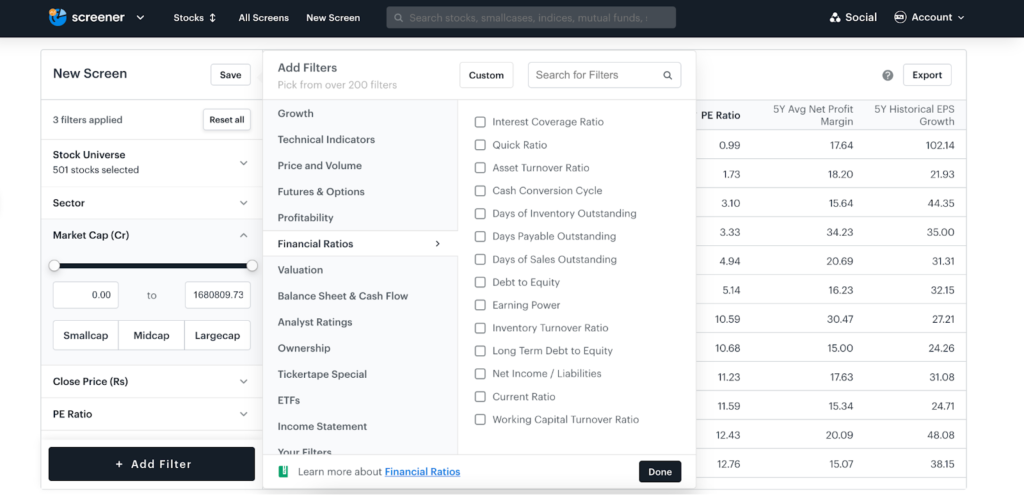
That’s it! In 2 simple steps, you can get a list of undervalued low-priced stocks at Tickertape.
Find Undervalued Stocks Within Minutes!
The process of screening and analysing stocks trading below intrinsic value sounds time-consuming. Instead, you can use Tickertape Scorecard. It is available on every stock page, making your analysis easy with quantitative scores. The Scorecard assigns scores or ranks to important parameters you would look at when evaluating a stock. The scores are as follows:
- Performance and financial score: First four cards, namely, Performance, Valuation, Growth, and Profitability, summarise the performance and financials of the company with scores on a scale of 0 to 10.
The performance score is calculated using 1Y return, 5Y CAGR, and 1Y forecast. Whereas the valuation score is calculated using the PE ratio, PB ratio, and P/CFO. The growth score looks at 3-yr revenue growth, 3-yr cash flow growth, and 3-yr earnings per share growth, and the profitability score considers return on equity, net profit margin, and cash flow margin. - Entry point based on fundamentals and technicals: These cards help evaluate if a stock is worth buying at the current price relative to its intrinsic value and at the current price (based on technical indicators).
- Red flags: These are divided into five separate metrics to give you clarity on what exactly the red flags are. It is a combination of five items: promoter pledged holding, Additional Surveillance Measures (ASM) and Graded Surveillance Measure(GSM)* lists, probability of default, and unsolicited messages.
*ASM and GSM are safety measures taken by the SEBI for the safety of the investors.
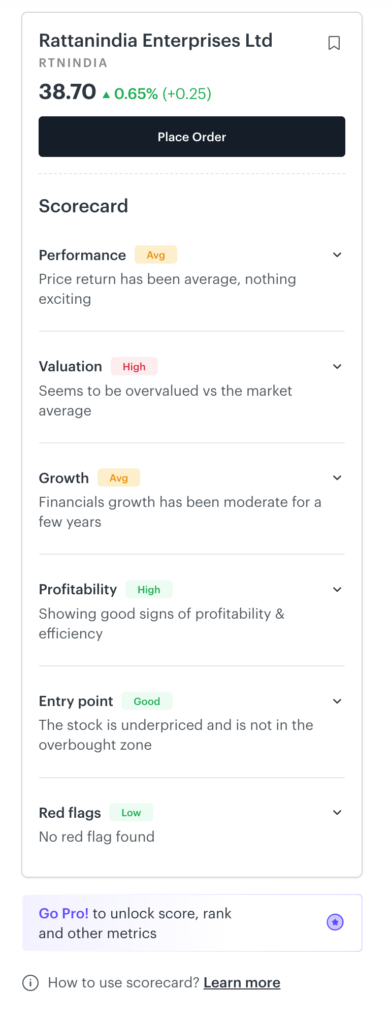
These scores give actionable information and allow you to make quicker, data-backed conclusions on whether a stock is good to invest in or not. Moreover, these take the stock’s peers into consideration, so you know how a particular stock is faring in the industry. So, what are you waiting for? Analyse any stock in under a few minutes using Scorecard. Analyse now!
Things to Keep in Mind
While all the above-mentioned ratios and techniques can help you pick undervalued stocks, it is important to remember that they are not the only criterion to consider when identifying undervalued stocks.
Stock markets often keep changing their mood and sentiments. If tomorrow the markets crash, you could find most stocks bottoming out. Now, this does not mean that they are undervalued or make for a good investment option. Similarly, many undervalued stocks for long-term investment may see their fortunes rising in an upward trend. This does not mean that they are overvalued.
The thing to remember is that picking a quality stock amidst market turmoils, which is common, can be challenging. A habit of deeply reading annual reports and ratios can help you pick brilliant undervalued growth stocks which are still not identified. Further, when making investment decisions, it is always wise not to consider unreliable sources like online media and word of mouth as the primary source of information.
Stock markets are all about timing. Multibagger stocks can be an excellent example here. To keep track of market mood, use Tickertape’s Market Mood Index (MMI) to time your investments better. It tracks the market sentiment – the attitude of investors towards the overall stock market or a specific stock. The MMI reflects the market’s mood in terms of fear and greed. To learn more about it and how to use it effectively, read this article.
Conclusion
By utilising the above-mentioned ratios and techniques, you can identify undervalued stocks with high potential and profit by making strategic investments. There is one more popular technique to identify stocks below their intrinsic value – Discounted Cash Flow (DCF). Here, a stock’s valuation is done by estimating the future free cash flows of a company and discounting them back to present value. If the price at which a share trades (in the market) today is lower than the valuation arrived at, such a stock could be considered undervalued. This method may vary amongst analysts because of their varying assumptions about future growth rates, capital structure, and discount rates.
You can get the data you need from Tickertape stock pages and Stock Screener. However, keep in mind that it is crucial to invest at the right time. Following herd mentality may not prove beneficial and can often be counterproductive. Hence, do your own research and consult your financial advisor before investing in any stock or scheme.
Frequently Asked Questions About Undervalued Stocks
1. How to determine if a stock is undervalued or overvalued?
There are four ways to find if a stock is undervalued or overvalued:
Analysis of the company’s financial statements
Discounted cash flow analysis
Relative valuation
Financial ratios
2. What are the most undervalued stocks in India?
The most undervalued stocks in India as of 4th June 2024 are:
– Raymond Ltd
– Aster DM Healthcare Ltd
– Power Finance Corporation Ltd
– Great Eastern Shipping Company Ltd
– National Aluminium Co Ltd
The best undervalued stocks for 2025 are filtered using Tickertape Stock Screener and are based on the following parameters:
– PE Ratio: Set low to high
– 5Y Avg Net Profit Margin: High
– 5Y Historical EPS Growth: High
– Stock Universe: Nifty500
As an insatiable reader and learner, I’ve spent the last two years exploring the world of finance. With my creative mind and curious spirit, I love making complex finance topics easy and fun for everyone to understand. Join me on my journey as we navigate the world of finance together!

