There are various ways of analysing investments before you make an investment decision. Technical analysis of the financial markets is popularly used for picking out profitable investments. It makes use of historical data to predict and identify stock movements.
So, let’s understand technical analysis’s meaning and various aspects.
You will Learn About:
What is a technical analysis of stocks?
Technical analysis of stocks is the process of analysing stocks’ historical price and volume movement to predict their future performance. Technical analysis uses stock charts and patterns to determine future price movements.
Basics of technical analysis

Some of the technical analysis basics include the following –
- Price of the stock
- Charts and patterns
- Volume
- Market trend
- Momentum, i.e., the pace at which the stock price changes
- Support and resistance levels
- Moving averages which measure the average movement of a stock’s price
- Indicators and oscillators
Return on equity: Highlights
- Technical analysis is the analysis of stocks and other investments using historical charts and statistics.
- The technical analysis considers the movement in the price and volume.
- Technical and fundamental analyses are different from one another.
- There are different indicators, charts and oscillators used in technical analysis.
Technical analysis strategies for beginners

Multiple stock market technical analysis strategies can help you trade profitably in the stock market. However, the strategies can be advanced, making them difficult to understand, especially if you are a beginner.
So, for beginners, here are some simple technical analysis strategies that can be used in trading –
- Find the market trend
A trend tells you which way the market is moving. An uptrend is when the prices are moving up, while a downtrend is when prices are falling. There’s also a sideways trend when the price fluctuates between high and low.
Identifying the trend would help you invest. Investing in an uptrend can give you attractive returns. On the other hand, if the market is in a downtrend, you can sell your stocks to cut further losses.
In other words, you can use trends to analyse market mood and use them to make profits.
- Find the support and resistance levels
The support and resistance levels are important indicators of price movement. They can depict whether prices would continue to move in the same trend or reverse.
Support signifies the area in which the demand is more than the supply. If prices reach the support level, they are expected to reverse to the upside. Resistance, on the other hand, signifies that supply exceeds demand. So, if prices reach the resistance level, they may start dropping.
Support and resistance levels can become good entry and exit points, provided the analysis is done thoroughly.
- Do a volume analysis
Volume can help understand the strength of a trend. You can assess the stock’s trading volume when checking the market trend. If the volume increases in an uptrend, the trend is expected to continue. On the other hand, if the volume reduces in an uptrend, the trend may reverse.
Fundamental analysis vs technical analysis
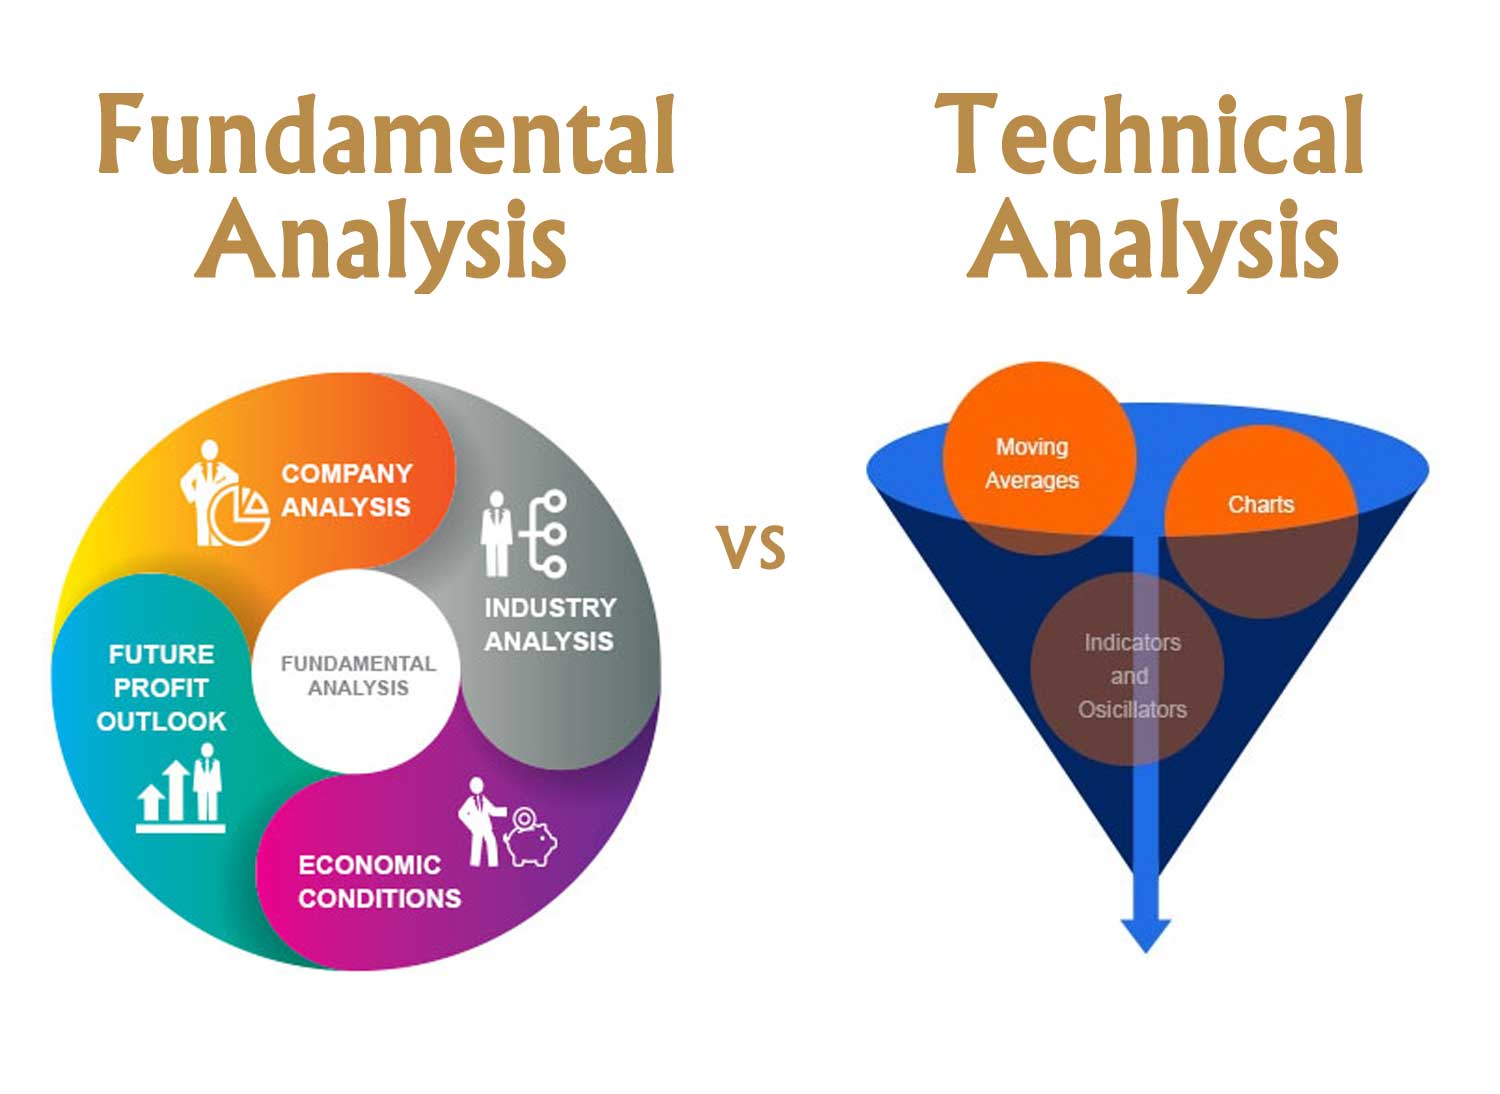
Besides technical analysis, there’s another form of analysis called fundamental analysis. Both these analyses differ from one another. The difference between fundamental analysis and technical analysis is given below–
| Fundamental analysis | Technical analysis |
| The analysis is done using a company’s financial statements, managerial practices and future prospects. | The analysis is done using historical charts and statistics and by measuring the movement of price and volume. |
| It is suitable for long-term investments. | It is suitable for both short and long-term investments. |
| This analysis is used by investors to gauge the intrinsic value of stock and to assess if the stock is overpriced or under-priced. | This analysis is to identify the entry and exit points in trading. |
| Trading decisions are based on a company’s financial standing and future potential. | Trading decisions are based on the expected price and volume movements. |
Dow theory in technical analysis

Introduced by Charles H. Dow, the Dow Theory is extensively used in technical analysis. The theory works on nine specific assumptions or tenets. These tenets and their meaning are as follows –
| Tenets | Brief description |
| Tenet #1 – Indices discount everything | Indices discount the known and the unknown. In the case of an unexpected event, the index is expected to recalibrate itself and depicts the correct value. |
| Tenet #2 – There are three main market trends | Primary trend, minor trend and secondary trend. |
| Tenet #3 – Primary trend | These are market trends that continue for a year or more. It is suitable for long-term investing. It can be an uptrend or a downtrend. |
| Tenet #4 – Secondary trend | This is a counter-trend to the primary trend. For instance, a downtrend for a small period in an otherwise uptrend market. The secondary trend might last up to months. |
| Tenet #5 – Minor trend | These are daily market fluctuations or noise. |
| Tenet #6 – All indices confirm with one another | Indices performing together point to a market trend. Only one or two indices moving in a particular direction do not make a trend. |
| Tenet #7 – Volumes should confirm | The trend should be in tandem with the volume. |
| Tenet #8 – Sideways markets can replace secondary trends | Markets might follow a sideway trend for years. In such cases, the sideways trend replaces the secondary trend. |
| Tenet #9 – Closing price is the most important | The closing price is extremely vital as it shows the final stock evaluation price. |
John Murphy’s technical analysis
John Murphy, a renowned technical analyst, has created ten important rules of trading based on his analytic career and experience. Here are his rules of trading based on technical analysis –
- Map the market trends.
- Identify the trend and follow it.
- Find the support and resistance levels.
- Know how far you should retrace to know corrections in a trend.
- Use trend lines.
- Follow moving average charts.
- Track oscillators to assess if the market is overbought or oversold.
- Use the MACD indicator to identify a possible trend reversal.
- Use the ADX indicator to understand if the market is following a trend or if it is just a trading phase.
- Use volume as a confirming indicator.
Pros and cons of technical analysis
The pros and cons of technical analysis are as follows –
| Pros | Cons |
| You can identify market trends. You can find the right entry and exit points for maximum gains. You can spot possible trend reversals and take suitable trading decisions. | It is not 100% accurate. It uses historical data, which does not guarantee future performance. It can be complicated for amateur traders to decode this analysis. |
Conclusion
Stocks can be analysed using both technical and fundamental analysis. The technical analysis considers historical data to predict future trends and market movements. It is best suited to gauge entry and exit points and to predict a stock’s future performance. It is generally employed for short-term trading. It must be remembered that technical analysis is not 100% accurate and can be very complex for investors to understand.
 – Meaning, Calculation, Example, and More")
