

Last Updated on Dec 14, 2022 by Anjali Chourasiya
After a pretty long rally, indices have shown some kind of pause. As mentioned earlier too, focusing on individual counters is the best strategy because many counters are starting the rally from extreme lows and are likely to outperform over mid to long-term periods. One such IT counter is Zensar Technologies. Let’s go through all the observations on the chart and understand formations.
Table of Contents
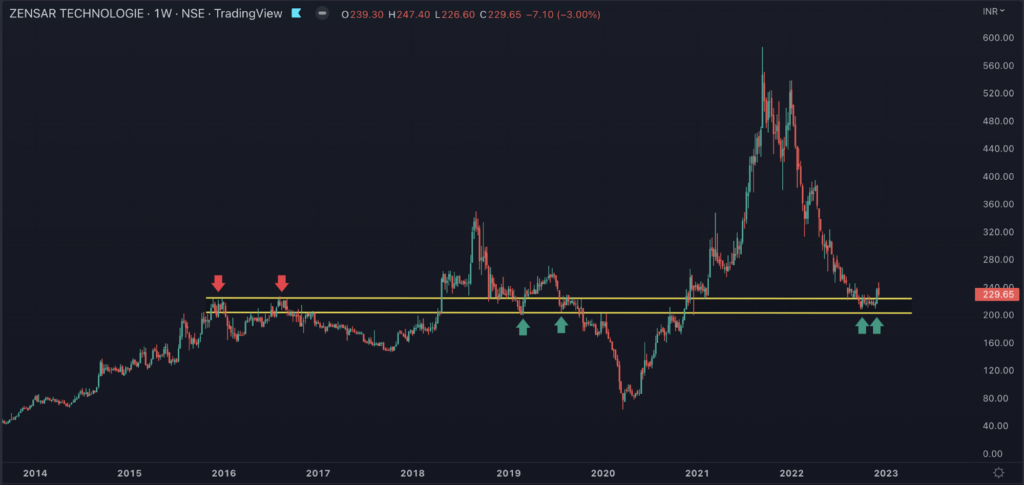
Weekly: Price action – Change in polarity

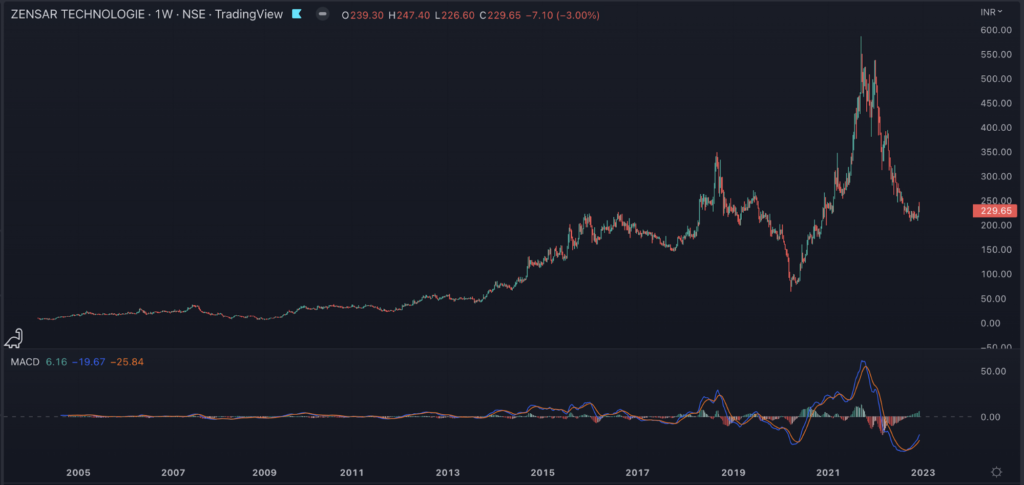
Since 2016, the stock is constantly respecting a zone highlighted with a yellow line. Major rallies have started above that zone, and major corrections have halted at the same zone, making it more reliable. We can see that the present correction of almost 66% from the top is also halting at the same zone. Looking at historical behaviour, this zone seems the best level to consider the counter for reversal.
Weekly: MACD
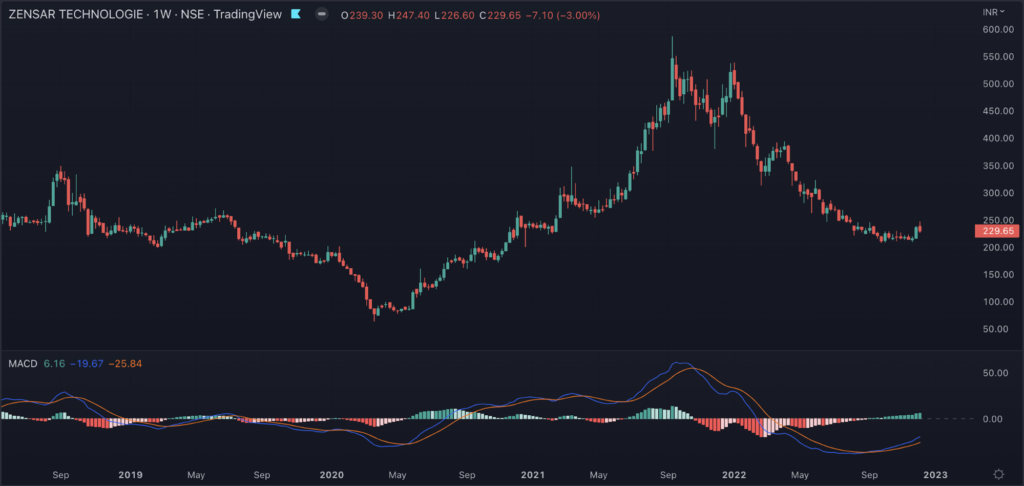
Two charts are shared for ease of comparison on the longer and zoomed formation.
In the entire history of the counter since listing, Moving Average Convergence Divergence (MACD), a lagging indicator, has never been to those extremes where it is trading right now. MACD has shown the first crossover, making this counter an attractive turnaround candidate. Going forward, as MACD crosses the zero line, it would give more conviction on the trend reversal.
If we look at price action alongside MACD, the price made higher bottom compared to the previous swing low, whereas MACD has made lower bottom compared to its previous swing low, highlighting “hidden bullish divergence”. One can consider this situation as a silent accumulation sign.
Weekly: RSI
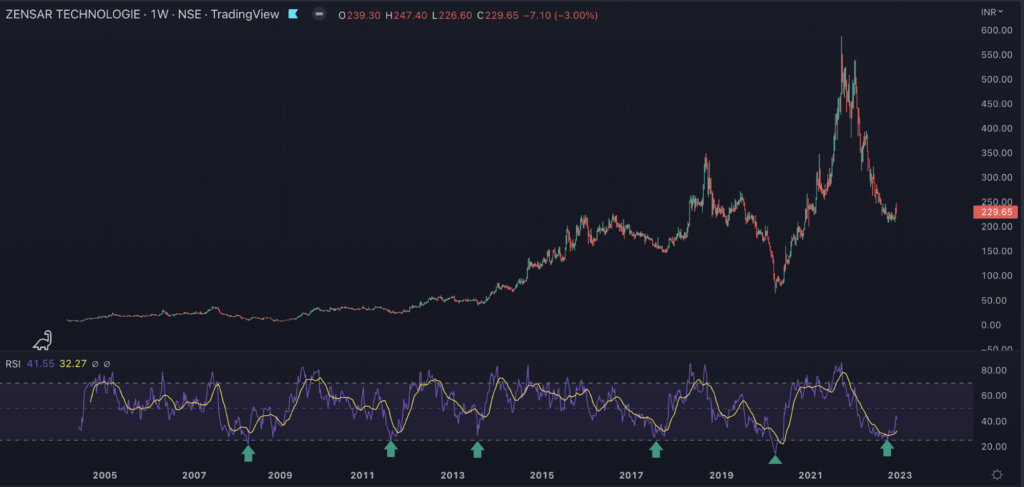
Relative Strength Indicator (RSI) is a momentum indicator. It shows the strength and momentum gathered at the counter. A typical observation has been noticed in the last 14 yrs. Whenever RSI reaches extreme lows of 25, the counter generally makes a bottom and reverses. Similar behaviour is repeated five times with almost 100% accuracy. Presently RSI made lows near the same zone and bounced along with price reversal. This offers one of the best bargain buying opportunities to accumulate the counter from a mid to long-term perspective.
Weekly: Bollinger Bands
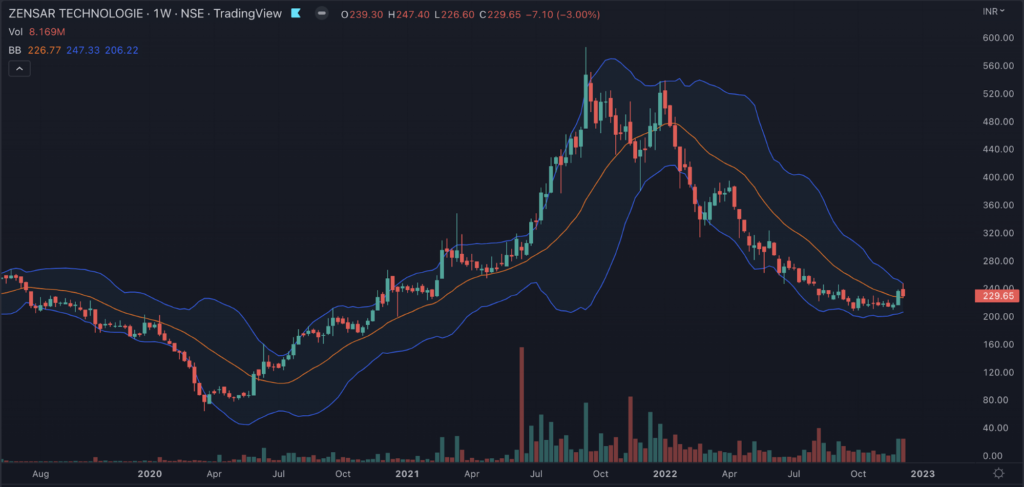
Bollinger Bands is a trend-following/trading indicator. This can serve the purpose of the trading signal as well as the trend reversal signal. Since the correction of 2022, the price has decisively remained below the midline of Bollinger (which is a simple moving average).
Recently, the price decisively crossed the average line on the upside with good volumes and remained above this. This is the first sign that the bottom is likely to be in place. Further, one needs to keep an eye on whether the price is getting plotted outside the bands on the higher side. On the happening of the same, one can expect a decisive rally in the counter.
Daily: Price action
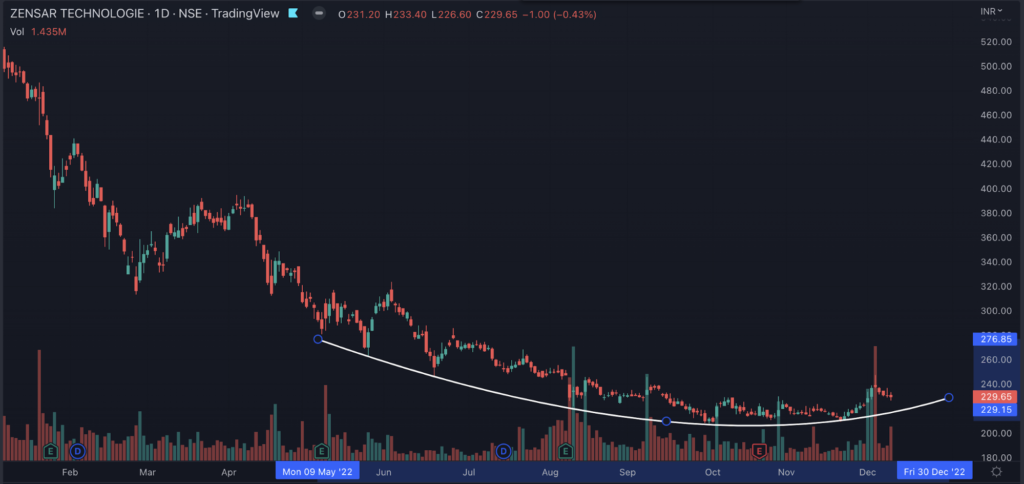
After a sizeable decline on the counter, a massive consolidation is seen on the daily chart. The highest volumes are noticed near lows where the price has entered the curve formation. This seems the perfect sign of the Accumulation phase of the counter, and one should keep an eye on all the formations from hereon to take advantage of the new rallies.
Daily: Ichimoku
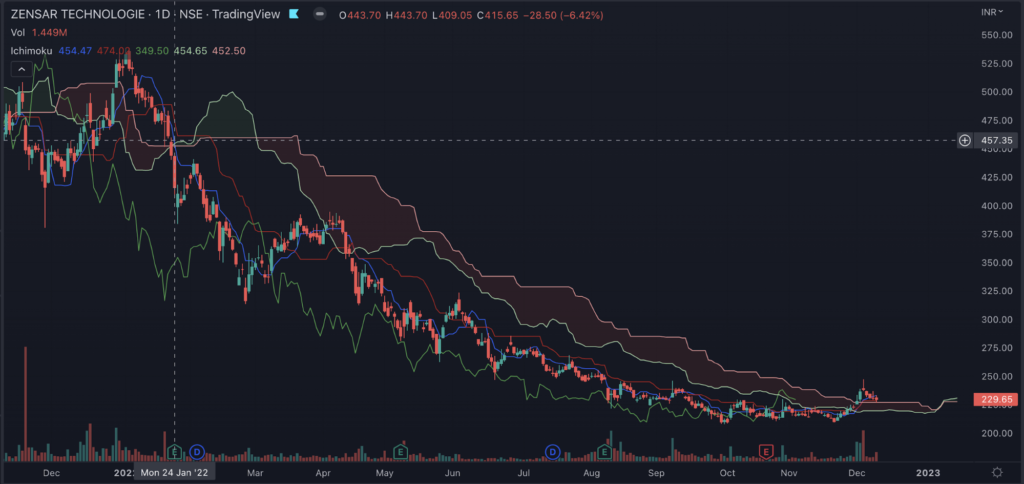
As I always mention in my articles, Ichimoku is one of the best indicators to follow for positional trades as it is an equilibrium indicator, highlighting the past, the present and the future on the same chart. During January, the price fell below the Ichimoku cloud (highlighted with curser) and remained decisively below the same. After almost 10-11 months, the price has crossed the cloud on the upside with good volumes and sustained above that for the first time. The future cloud is also turned bullish along with the Tenkan-Kijun crossover. Any further bounce from hereon will be a fantastic opportunity to accumulate the counter from a short-term to mid-term perspective.
Daily: Supertrend
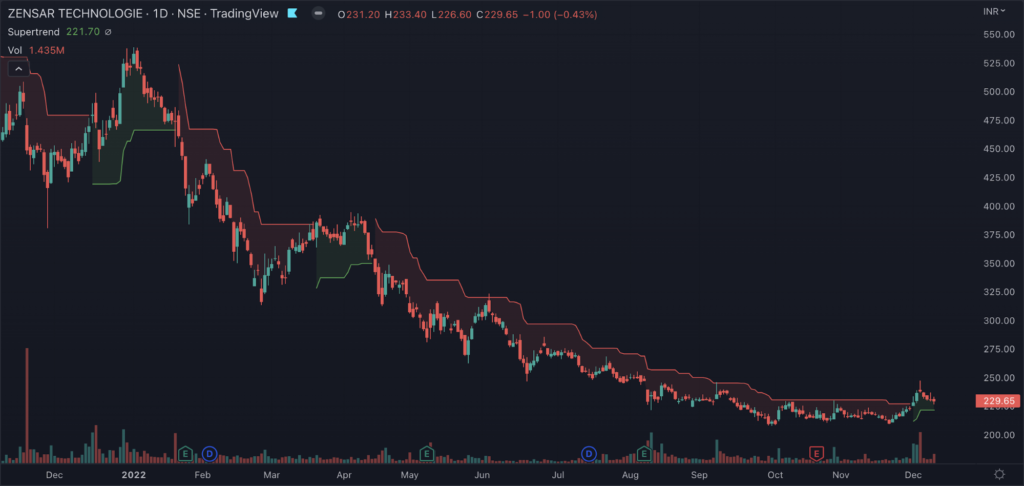
As amazing as its name, the supertrend indicator worked just as an amazing resistance for the counter for many months. Finally, the price crossed the supertrend on the higher side with volumes, showing the first sign of bottoming out. There is a bright possibility of the emergence of a new trend from hereon with very limited downside on the counter.
Ratio chart: Zensar Technologies Vs Nifty IT Index
In the last 14 yrs, the ratio chart has 4 times tested the highlighted support line. Recently, the ratio chart again hit the same support line and bounced from the support line. The uptick in the ratio chart confirms the possibility of the outperformance of Zensar Tech over the Nifty IT index. Along with all other observations discussed earlier, one can certainly expect outperformance over the Nifty IT index.
Putting it all together
Looking at Weekly price action with change in polarity, extremely oversold MACD crossover, extreme low RSI (reversing from 25 zones), and Bollinger Band crossover with volume makes the counter an attractive mid-term to long-term bet. The daily chart curve formation with massive volume with Ichimoku Kumo Cloud crossover and supertrend crossover suggests the same. The ratio chart also supports the counter’s likely outperformance over the Nifty IT index.
Statutory Disclosure: Kindly note that this update is only for educational purposes. It is safe to assume that my personal position, my fund’s position, my client’s position and my relative’s position may be open on the counter. Prefer to take the advice of your financial advisor before initiating any position.

- Avenue Supermarts: Is Dmart Providing Shopping Opportunities for Portfolios? - Mar 29, 2023
- GMR Airport Infra: Counter on Runway To Fly Soon! - Mar 21, 2023
- SW Solar: Is The Counter A Good Bet From Long-Term Perspective? - Mar 14, 2023


