

Last Updated on Dec 6, 2022 by
When it comes to stock or mutual funds, the price is not the only factor that you should track. Observing the key metrics is equally important as it gives you context and insights into the performance over time.
Previously, you could track the prices of assets over various timelines and link your Watchlist to Basket. But keeping in mind the importance of key metrics in identifying investment opportunities, we have updated our ‘Watchlist’ to have much more.
Let’s take a look at what is new in Tickertape’s Watchlist.
Update 1: Fundamentals, Technicals, and Forecasts in the Equity Watchlist
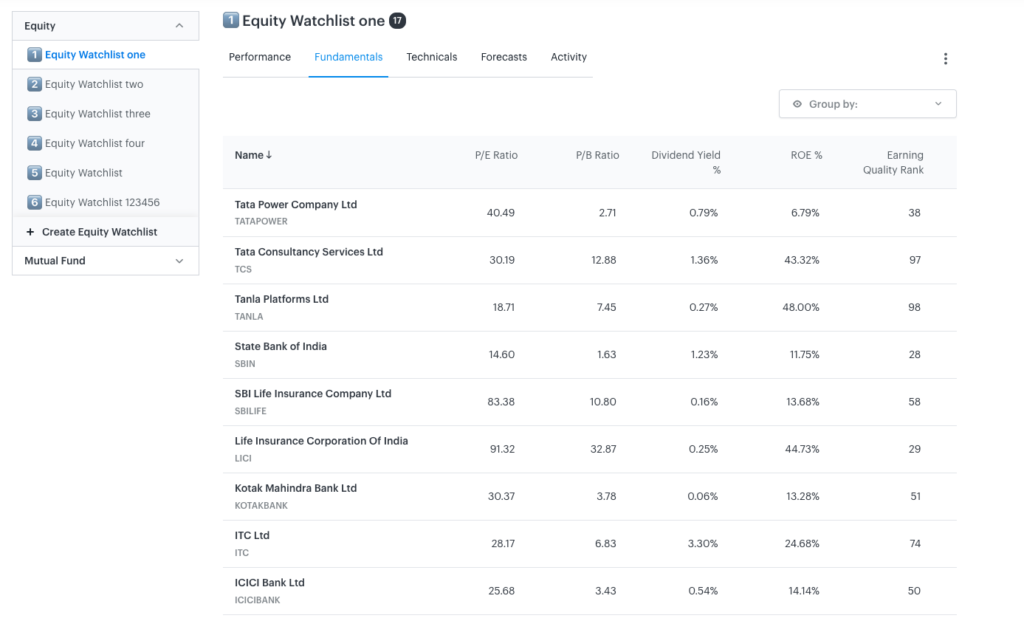
We have added three new tabs of information to the Equity Watchlist – fundamentals, technicals, and forecasts. Now you can quickly go through a company’s key metrics before buying or selling the stocks you track.
- Fundamentals tab: Displays certain important financial metrics of a company, which can help lay a strong foundation for your investment decisions. It features essential metrics like the P/E ratio, which helps in determining whether a stock is overvalued or undervalued. Other metrics like P/B ratio, Dividend Yield, ROE, and Earning Quality Rank are also available.
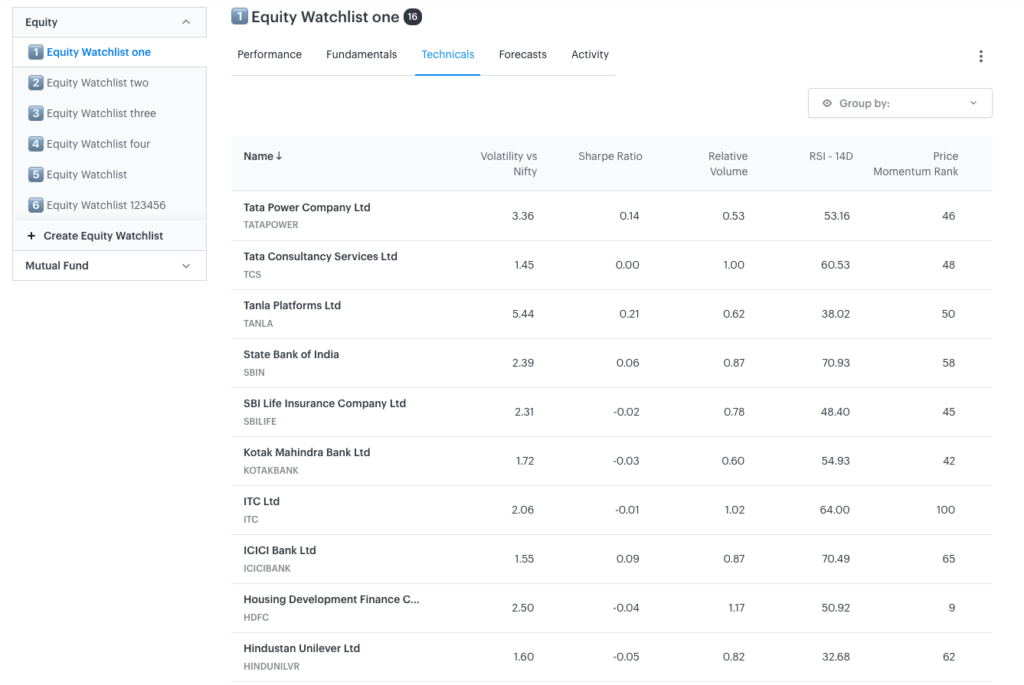
- Technicals tab: The metrics under the technicals tab help in identifying the price trends and patterns of a stock. For instance, Sharpe Ratio helps an investor understand whether the risk they are taking will fetch good returns or not. It also has different metrics like Volatility vs Nifty, Relative Volume, RSI – 14D and Price Momentum Rank.
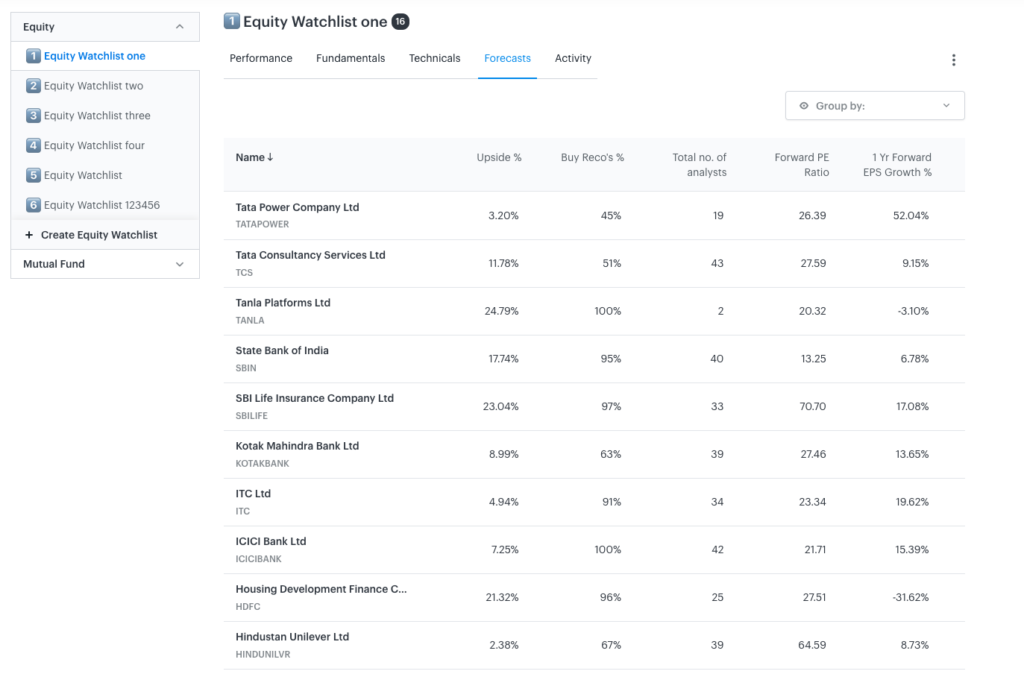
- Forecasts tab: In order to make informed decisions and plan your investments, we have also added stock forecasts. It includes metrics like Upside %, Buy Reco’s %, Total number of analysts, Forward PE Ratio and 1 yr Forward EPS Growth.
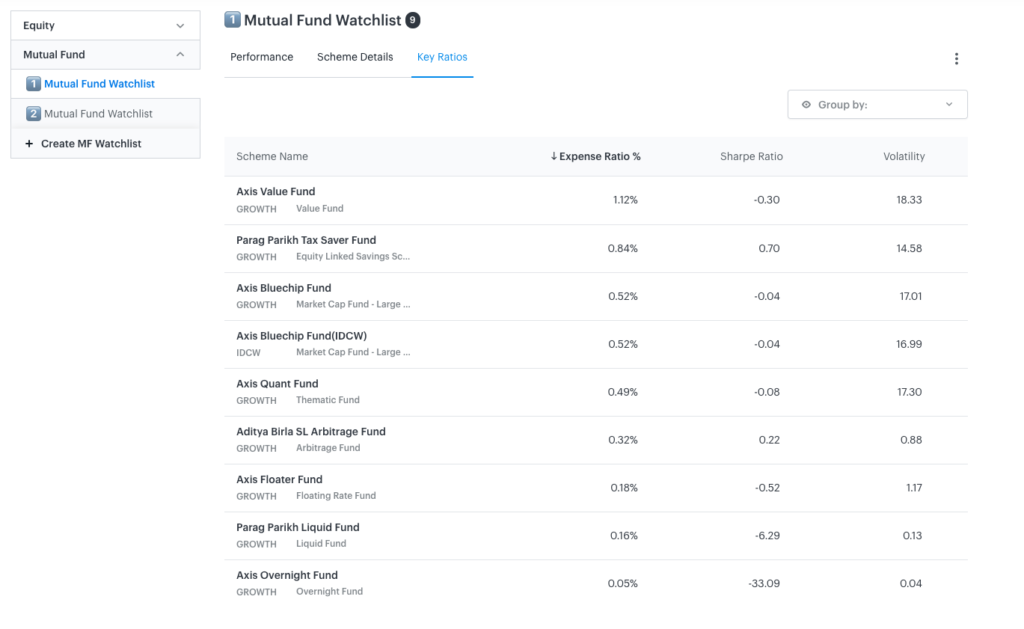
Update 2: Scheme Details and Key Ratios in Mutual Funds
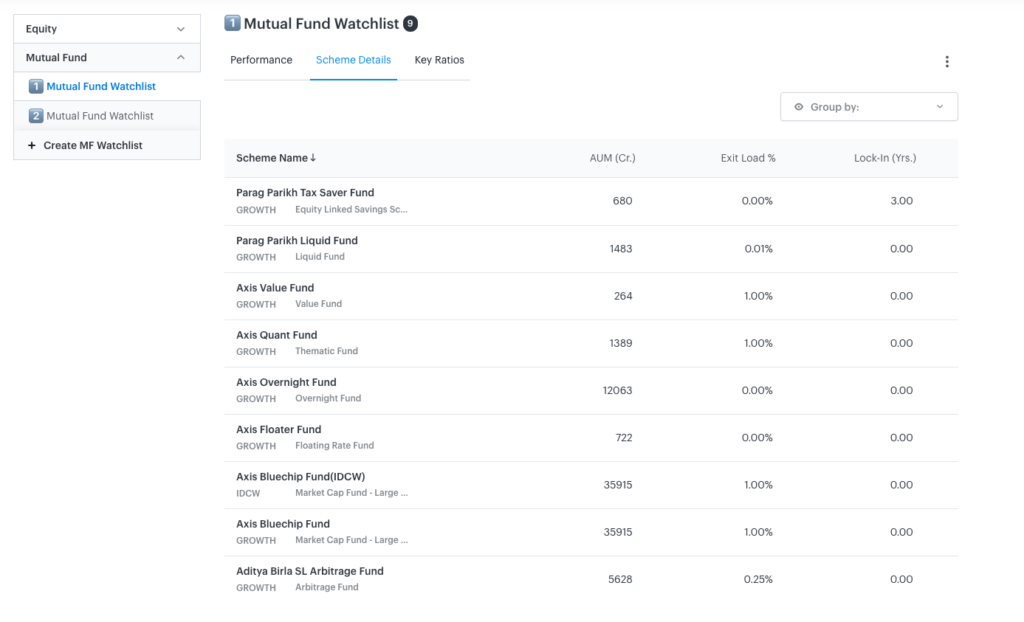
In addition to the ‘Performance’ tab in the Mutual Fund Watchlist, you can now see two new tabs, i.e., ‘Scheme Details’ and ‘Key Ratios’.
- Scheme details tab: Gives you a quick overview of the fund in terms of AUM, exit load and lock-in years, which are essential metrics to look at while investing in mutual funds. For instance, exit load is the fee charged by the fund house if the investor exits the scheme partially or fully before the lock-in tenure.
- Key Ratios tab: In this tab, you can find the important metrics, i.e., the expense ratio, the Sharpe ratio and volatility, which are essential to analyse the performance of a fund.
Through the new updates to the “Watchlist”, we bring together the essential metrics of stocks and mutual funds in one place. This way, you can track and quickly analyse your desired assets on the go without having to go back to the individual asset page. Doing this will save time in all the to and fro and will make your investment decisions faster and smoother.
A well-known American investor Peter Lynch said, “Behind every stock, there is a company. Find out what it is doing”. And our new additions to the ‘Watchlist’ is all about getting a quick view of the key metrics of a stock or a mutual fund.
Check out our new “Watchlist” now! The new additions are available on the app as well. Update the Tickertape App to monitor your stocks and mutual funds contextually!
- How to Invest in Digital Gold on Tickertape - Feb 12, 2025
- Understanding the Price Increase for Tickertape Pro on Apple Devices - Apr 25, 2024
- Introducing Alerts: Your Personalized Gateway to Informed Investing! - Apr 18, 2024

