

Last Updated on May 26, 2023 by Ayushi Gangwar
Have you been sailing through a sea of stocks, wondering about your next best investment and if it’s actually worth your time? Honestly, we all have been there. Finding a worthy investment for your Portfolio is something every investor focuses on, and that’s the way it should be, right? So, how do you know if a stock deserves your hard-earned money and which factors can help you decide? Worry not. Today let’s dive deep into a critical skill that every investor, be it a newbie to an expert, needs: A 360-degree analysis approach for any stock in simple steps!
If you are someone who is looking for years of analysis at your fingertips or have a hard time dealing with numbers and data, this article is going to make your investing experience much better!
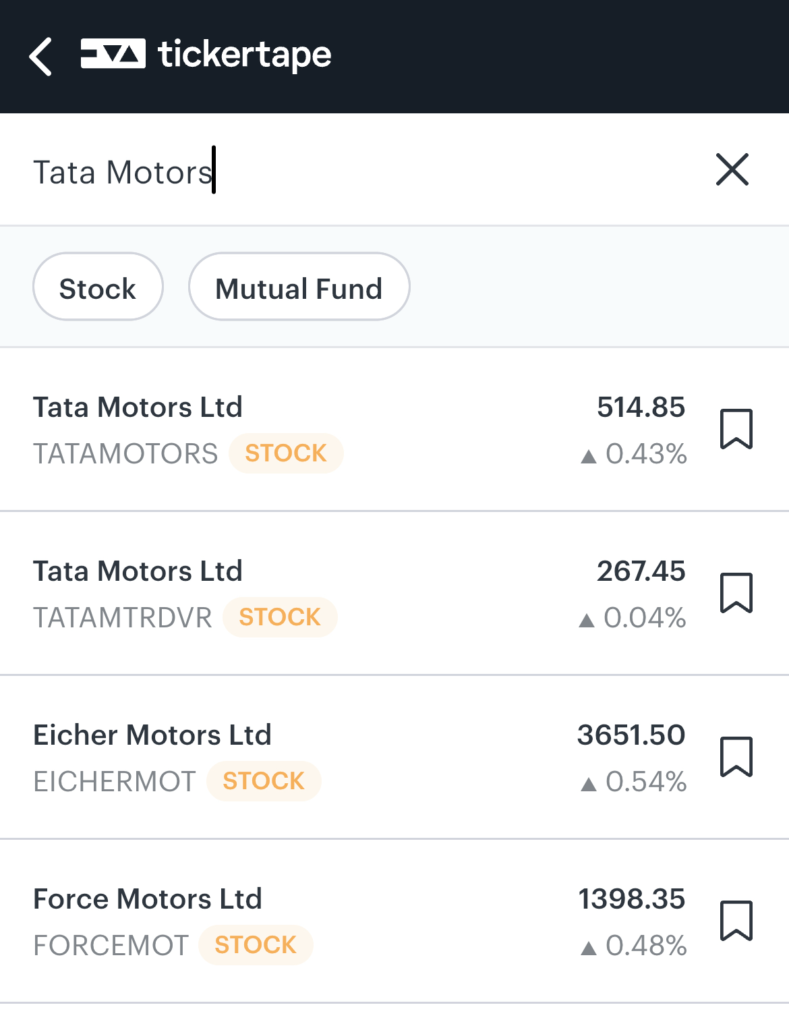
Let’s pick Tata Motors for this super-easy guide and show you how to analyse stocks smarter than ever, like a Pro!
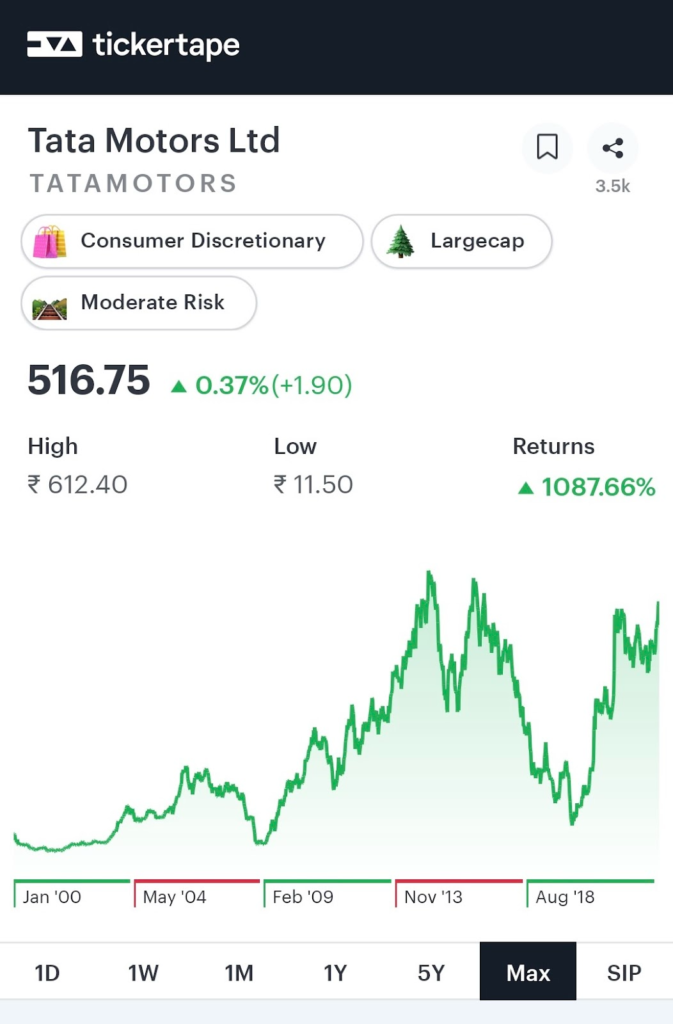
First things first, search for Tata Motors’ stock page on Tickertape and look at the price charts for a simple yet brief overview of the stocks’ growth.
If you are in for the short haul, you can look out for 1W growth, but if you are more of a long-ride person, you can go as far as five years’ growth in just a tap. That’s not all. With multiple ranges varying per week, month and year, you can look at the price chart however you want to determine how far the stock has come.
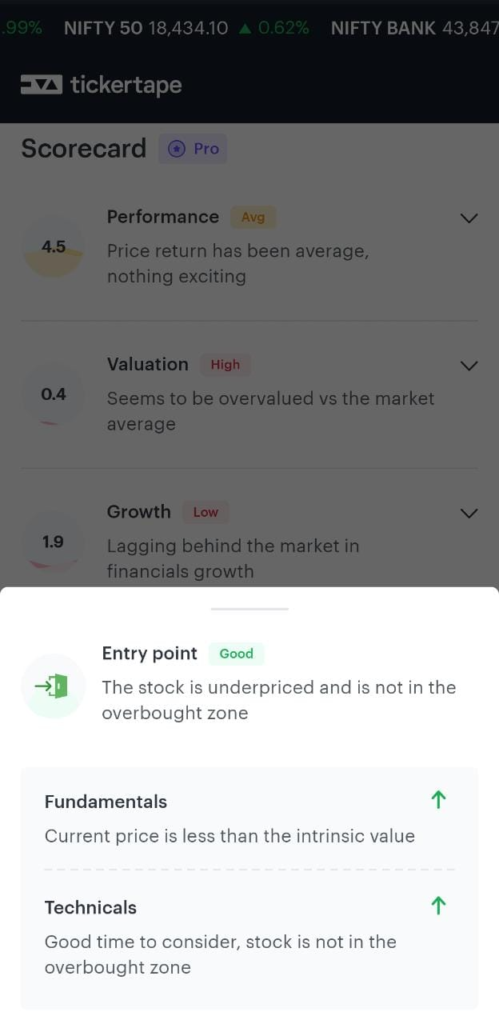
But if you are still unsure whether the growth rate is exciting enough for you to add that stock, you can check out Tata Motors’ Scorecard. With various metrics ranging from performance, and growth to valuation and profitability, it’s like a report card with rankings out of 10, which can help you see if the stock is doing great, good or average. The best part? Scorecards’ Entry Point! An indicator that tells you if the stock is overpriced or not and lets you know if this is the right time to add it to your Portfolio based on Fundamental and Technical analysis. All of this is driven by data, experts and our unique formulas! Going Pro is a plus here, as it can help make easy analysis even easier and unlock more Scorecard metrics
Like here! Voila, it looks like Tata Motors is in the good zone!
Almost convinced by the data, but do you want to dig even deeper and check out what’s going on with the stock yourself? That’s sorted! Head over to Financials. Heaven for investors who like to play with numbers! It goes without saying, Financials is like vitals but for stocks, they can tell you how healthy accompany is doing and let’s face it, if you don’t check on Financials, you are pretty much ignoring your stocks’ health altogether! Here, you can analyse the financial trends based on multiple views like Growth, Margin and Annual as per your preference while looking at Income, Balance Sheet and Cash Flow in no time. All of this is broken down into pieces to make it easy to understand and evaluate. And did you know? You can look at recent Q4 reports from 2023 and access reports from up to ten years ago from 2013, all in the same place.
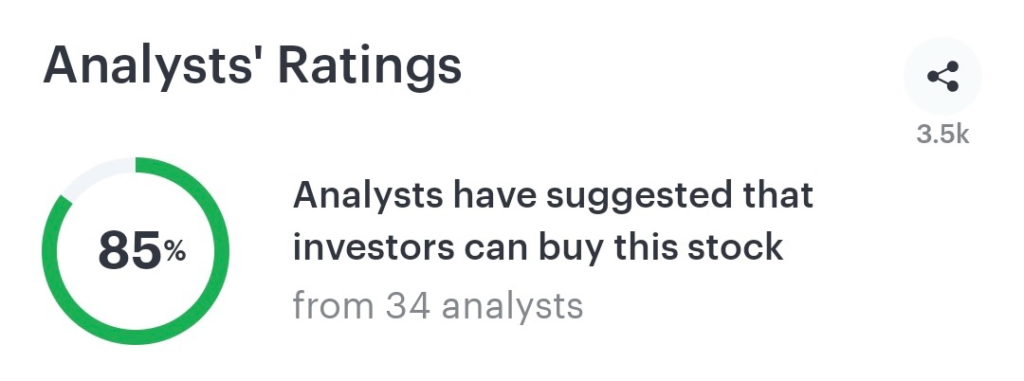
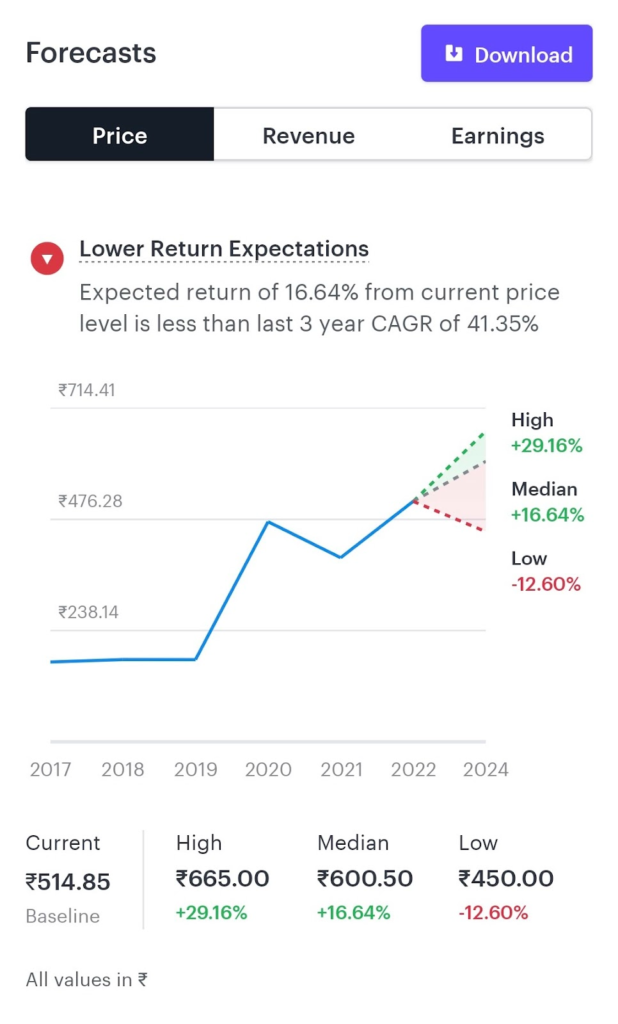
You did it! You know the income, the profit, the growth and what’s been going on in the past, but you wonder, what will you earn from this? What does the future of this stock look like? With Forecasts, you don’t have to worry about it all! Tata Motors’ past trends and our experts-in-action determine where the stock is expected to go in the near future and give you an estimated growth rate for not just one or two but three different dimensions: Price, Revenue and Earnings per Share (EPS). In 2023, you can see where the stock level, business prospects and profits are expected to be next year, in 2024, a whole year ahead, right now! And to make your decisions quicker, we also have Analysts’ Ratings, where you can check out how many experts have recommended buying a stock. (FYI: 88% of experts are recommending Tata Motors right now) What a good way to jump into the future, isn’t it?
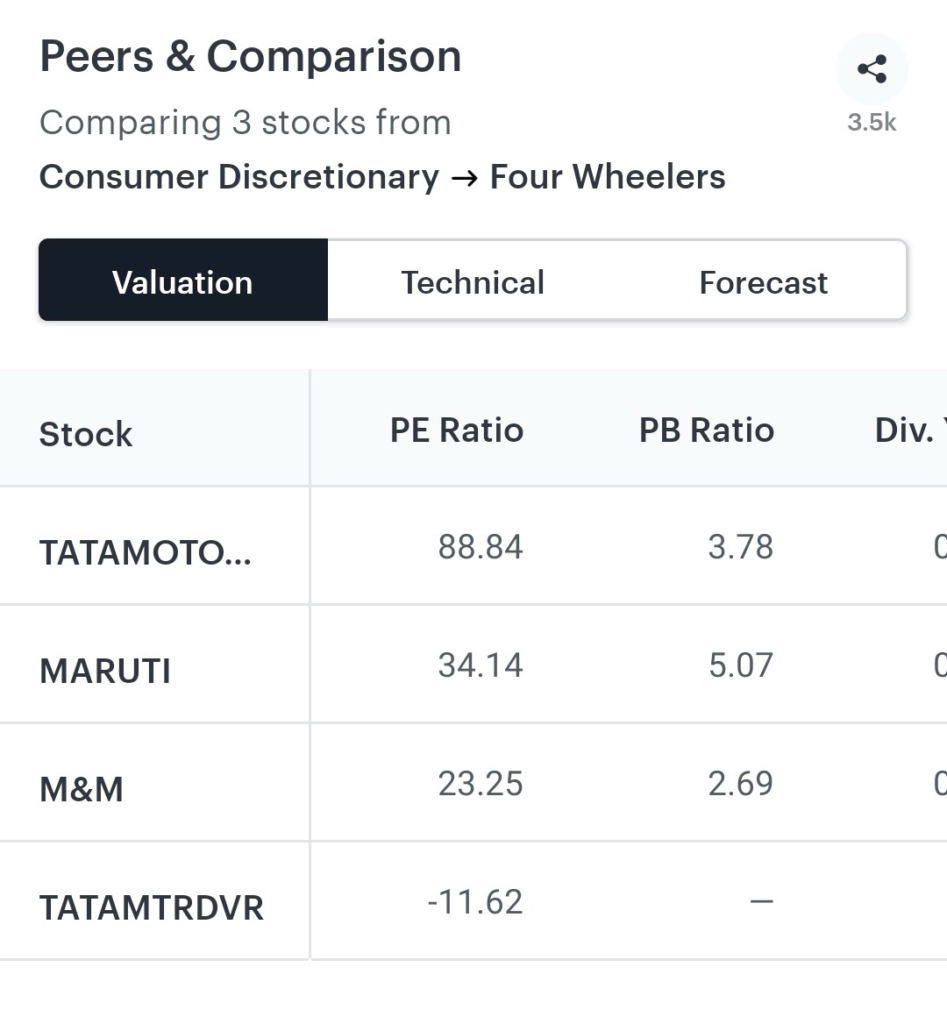
The past and future are sorted. You know all things there are to know about Tata Motors, but why stop at one stock? Don’t you want to know if Maruti Suzuki or Mahindra & Mahindra are doing better? So, why not compare other stocks in the same sector and look at who is doing better? With Peers, you can find out if Tata Motors is doing better than others by comparing it based on Valuation, Technical and Forecasts. Three months, six months, a whole year or a customised date range, you can compare which of your stock peers has shown a growth in price while editing which all stocks you want to compare. Believe us! It is a convenient way to find out which stock is leading the race and for what time in just seconds, and when you become a Pro member, looking at the future is even faster because you unlock hidden insights and filters as well.
Congratulations! You are now an investing wizard! From looking at Financials to Forecasts, you have got it all in and are all set to analyse better with us and use our features and filters to the fullest while keeping an eye out for what’s best for your Portfolio. So, still stuck at reading? Why not start analysing and put all your new skills to the test if you are looking to put a boost on your already simple and smooth analysis, give Tickertape Pro a go!
Get, set and analyse one of the most viewed stocks on the market right here! Tata Motors is waiting for you!
Until next time, happy investing!

- Scheduled Orders - May 5, 2026
- What is Loan Against Securities (LAS)? - Mar 30, 2026
- Akshaya Tritiya’26 on Tickertape – Terms and Conditions - Mar 24, 2026

?")

