

Last Updated on Nov 11, 2022 by Anshiya Tabassum
Stock markets are an investment vehicle for significant wealth creation. However, it cannot be done overnight. It involves a process of considerable learning and following your time-tested principles consistently as selecting one stock out of a pool of them would be overwhelming. One of the ways that people use to find a good investment is by using various tools and methods. Financial ratios are one of them. In this article, we will discuss a popular financial ratio – price to book ratio.
Table of Contents
What is fundamental analysis?
Fundamental analysis involves investing in stock after understanding the nitty-gritty of the business in greater detail by using various tools and methods. Financial ratios are one of the most used tools to compare the company with itself (current vs historical) or with its peers.
Some popular ratios are price-to-earnings, debt-to-equity, return on equity, current ratio, etc. The usage of any particular ratio depends on the sector, industry, and company that you are analysing. One of the ratios that we would be discussing here is the price-to-book ratio.
Price-to-book value ratio
Price to book value or the P/B ratio is used to compare a company’s market capitalisation to its book value. It can be calculated by dividing the price per share by the book value per share (BVPS). It is the assets of the company less its liabilities per share or total shareholder’s equity per share. It shows the value of the company that remains after the assets are liquidated and all debts are paid.
The price per share denotes the price that market participants are willing to pay based on forward-looking metrics which reflect the company’s future cash flow. While the BVPS is an accounting measure, which reflects the historic cost principle.
PB = Price per share / BVPS
Calculation PB ratio
Let’s take an example of ABC Bank to understand the calculation:
| Particulars | Figures (as on 31/3/2022) |
| Price per share | Rs. 100 |
| Total equity (Book value) | Rs. 600 cr. |
| Total outstanding shares | 20 cr. |
| BVPS* | Rs. 30 |
| P/B^ | 3.33 |
*BVPS= Total equity / Total outstanding share = Rs. 600 cr. / 20 cr. = Rs. 30
^P⁄B = Price per share / BVPS = Rs.100 / Rs. 30 = 3.33
The above calculation will help you understand the formula lot better, but you don’t need to calculate the ratio every time you research a new company. You can find the P/B ratio by searching individual companies through Tickertape from the “Key metrics” sub-section under the “Overview tab”. Tickertape helps you source the data, information and content for Indian stocks, mutual funds, ETFs and indices.
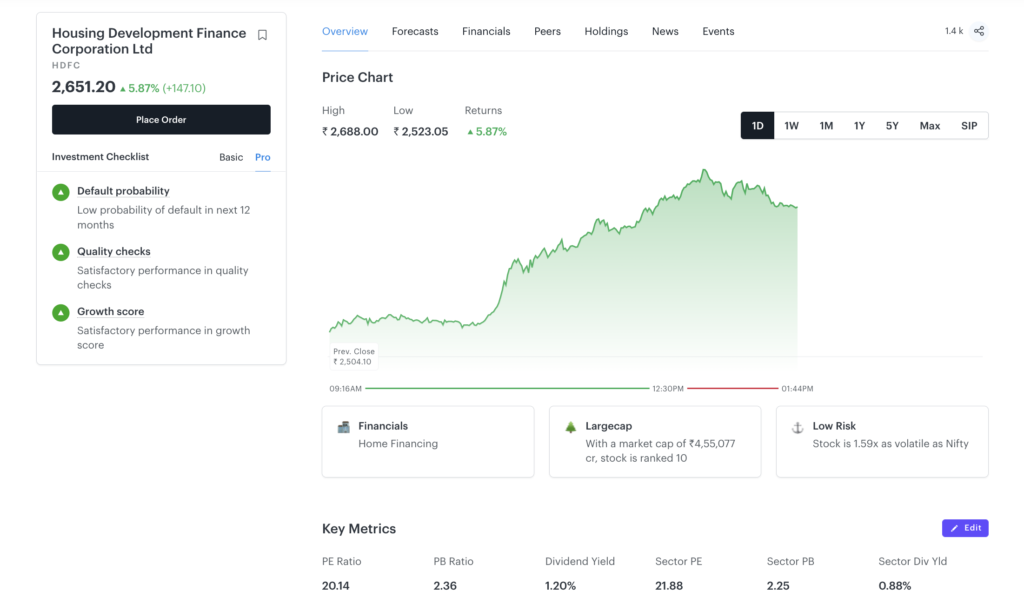
Figure 1: Overview section of HDFC Bank in Tickertape
Interpretation of the P/B ratio
It is important to understand the interpretation of the P/B ratio. The calculated P/B ratio of ABC Bank was 3.33, which means that for Rs. 1 of the net asset of ABC Bank, the investors are willing to pay Rs. 3.33. The ratio is also used to know if the company is undervalued, overvalued, or fairly valued. It is used in conjunction with other metrics to know if the valuation is justified.
You have to compare the P/B ratio of companies within the same sector/industry. You can either compare the ratio with individual peers or with the sector average. The stock with a lower ratio would be considered undervalued in both comparisons.
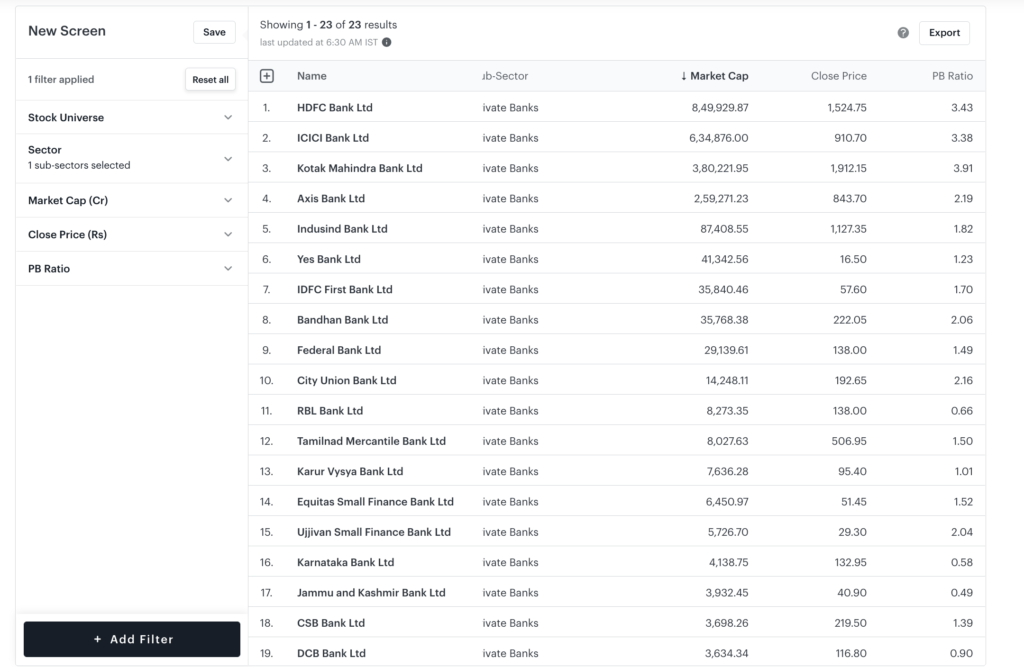
For e.g., Let’s analyse HDFC Bank with the help of Tickertape. Fig 2 shows a comparison through the “Peers tab” under an individual company page (compare with three close competitors) and Fig 3 shows the “Stock Screener” tool (compare with all listed competitors) used for comparison. You can also apply an additional filter on the “Stock Screener” tool to customise your comparison based on other metrics.
Figure 2: Peers section of HDFC Bank in Tickertape
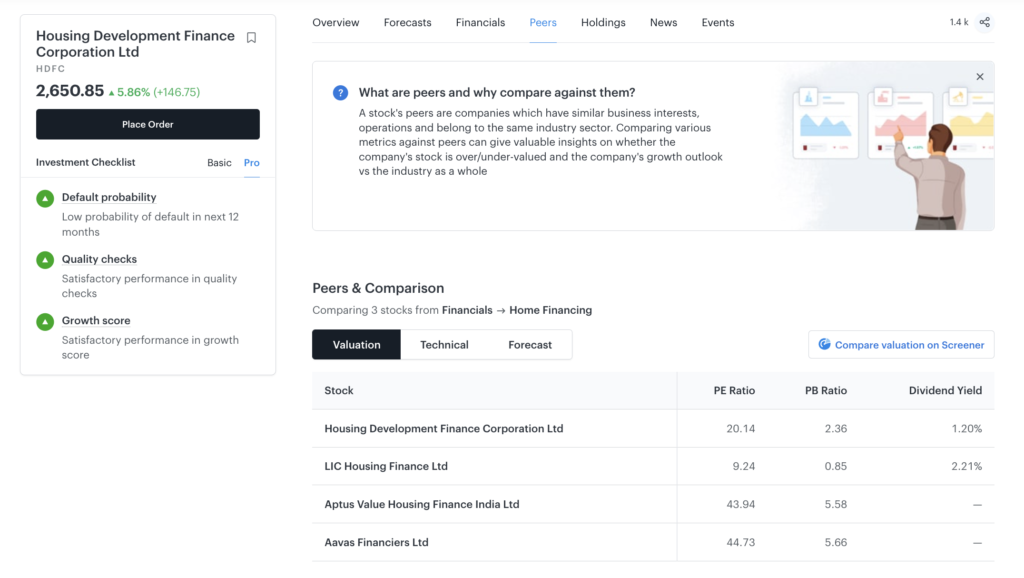
Figure 3: Tickertape’s Stock Screener
We have filtered using the Private Bank subsector and market capitalisation to make our comparison meaningful. A quick glance will tell you that HDFC Bank is the largest private-sector bank based on market capitalisation and still has a P/B lower than the next biggest private-sector banks.
Another way to look is to compare the current P/B ratio of a particular company with its own historical levels/averages. If the P/B ratio has a history of mean reversion, the same can be used to know the current valuation. The same comparison can be done for a sector or industry to know if they are undervalued, overvalued, or fairly valued.
Ideal P/B ratio
It is not advisable to compare companies of different sectors based on the P/B ratio as the ideal P/B ratio would be different for different sectors.
Conventionally, any value less than 1 indicates that the stock is undervalued as it shows that the accounting value of an asset if sold, will fetch more than the current market price. However, a P/B ratio of less than 3 is also preferred by value investors.
Where is it useful?
The P/B ratio is most useful when your book value is a good representative of the market value of the assets and also in capital-intensive business e.g., banking sector, financial services, etc.
Drawbacks of the P/B ratio
The P/B ratio may not be useful for every sector. A sector like Information Technology has high human capital (employees) or brand value, crucial for a company’s success. The ratio may not be useful as such value is not captured in the company’s assets.
A company with a high depreciating asset would not get a value that is mentioned as Book value, so caution should be administered.
A low P/B ratio might also indicate that the company is in financial distress with losses, high NPAs, or a lower capital adequacy ratio. Using the P/B ratio in conjunction with other metrics would be more useful.
Important pointers to be kept in mind
Along with analysing the P/B ratio, one should shortlist companies with high cash flow generation capacity, low D/E ratio and future growth. The companies shortlisted based on the P/B ratio should be further analysed to remove any companies with high debt, consistent loss-making, or poor growth visibility.

- Government Policy’s Role in Energy and Transportation Opportunities - Nov 6, 2023
- How To Take Advantage of Small-Cap Stocks To Make Good Profits - Apr 12, 2023
- What To Expect From Green Energy Sector in 2023? - Jan 19, 2023


