


Vasanth
Nov 29th, 2018
3 Month Market Prediction with MMI
Using Market Mood Index to predict Nifty returns in the 3 months following the Extreme Fear zone.
MMI has been designed to help investors better time their trades and investments. It is a sentiment index which measures the current mood in the market.
The index describes the market mood using a scale of 0 to 100. The idea is not to be bothered about the exact value of the MMI, but to focus on zones — buy in high extreme fear (values below 20) and sell in high extreme greed (values above 80). You can check out all the details about MMI and different sentiment zones here.
The objective of this post is to check how accurately MMI predicts market returns in the 3 months following the extreme fear zone.
Test
- Identify the dates when MMI entered extreme fear zone (MMI<20)
- Check returns generated by Nifty in the 3 months following the date when MMI entered the extreme fear zone
Results
The chart below shows all the dates since (March 2012) when MMI dropped below 20 and the returns generated by Nifty in the next three months
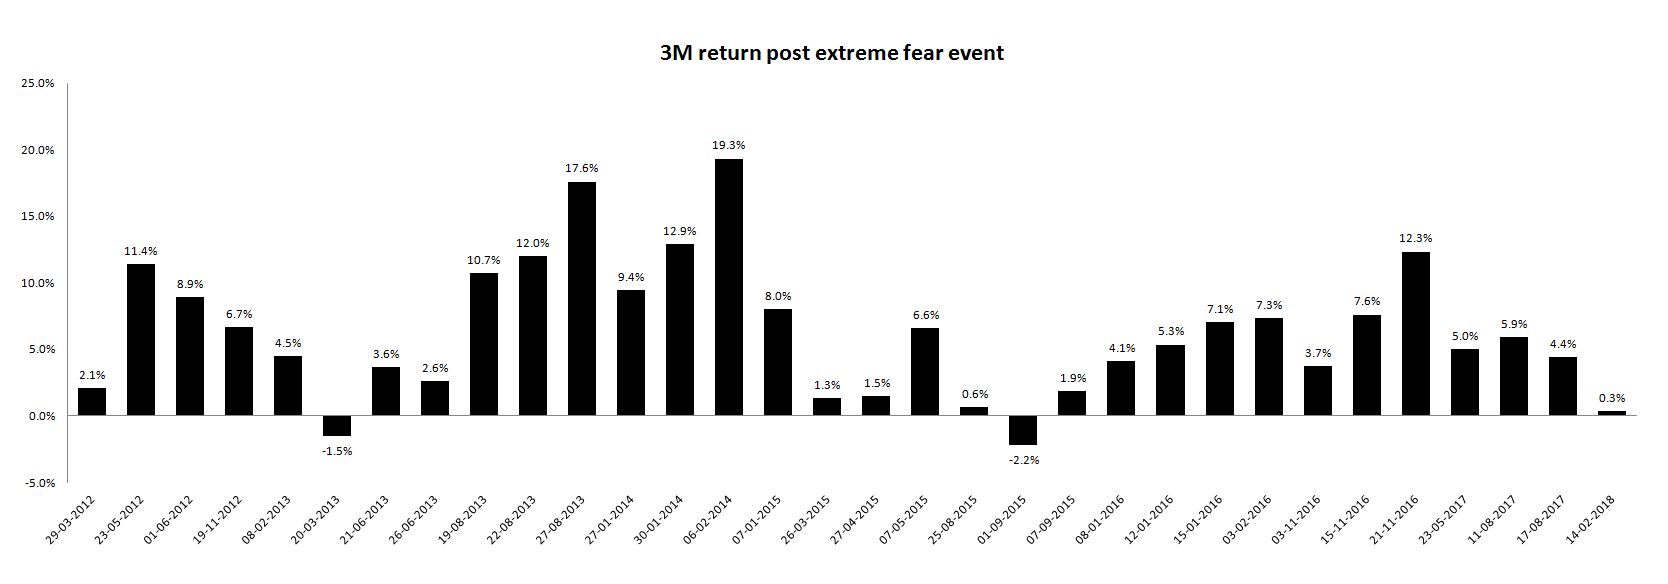
There were a total of 32 cases when MMI dropped below 20. Out of these 32 cases, 30 times Nifty generated a positive return in the next 3 months. This represents a success rate of 93.75%. Average return generated by Nifty in the 3 months post MMI dropping below 20 was 6.3% and the median return was 5.6%.
The current value of MMI on 24th Oct, 12:21 pm is 22.81. It just came out of the extreme fear zone. It will be interesting to see what happens this time.
MMI is not a trade recommendation tool and is only designed to help investors better time the market, once they have decided to invest. This analysis just highlights one of the many ways in which MMI can be used.
Related Posts
Add a comment