

Last Updated on Apr 12, 2022 by Anjali Chourasiya
This article is authored by Kunal Rambhia, a fund manager at The Streets, a private fund. He has been in the equity market since 2010, performing various roles such as Associate Research Analyst, Research Analyst, and Associate Portfolio Manager. He has media appearances with CNBC and ET NOW. Kunal is also a visiting faculty in multiple colleges.
As discussed in the past technical updates, markets offered wonderful bargain buying opportunities and many counters delivered wonderful returns so far. Still many opportunities are available at reasonable levels. Herein I share my view on one of such opportunities, SAIL (Steel Authority of India Limited), which is from the metals as well as PSE segment.
Table of Contents
Monthly (price action)
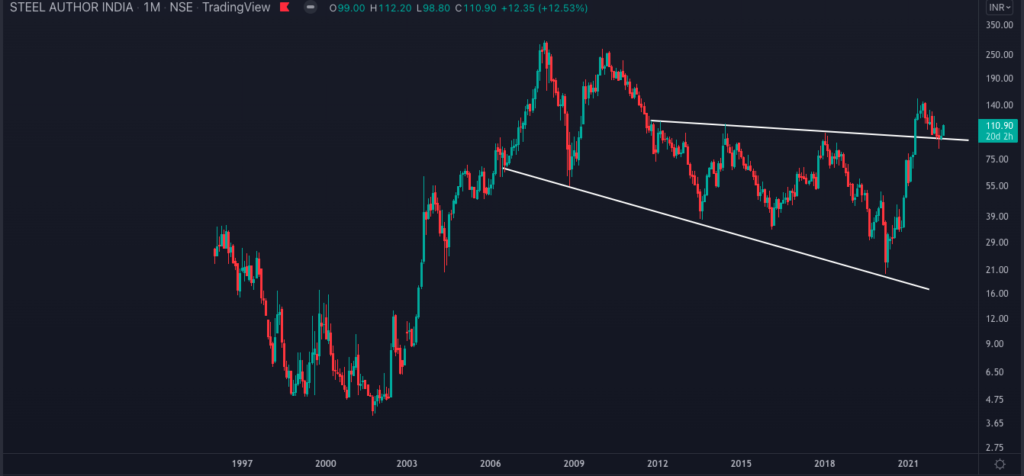
On the monthly chart, we can see the dream rally between 2003 to 2007. Since then, the price remained in the downtrend, making a series of lower tops and lower bottoms between 2008 to 2020. The second dream rally in Indian equities was seen after 2020, where SAIL broke out of consolidation (Falling expanding wedge) formation. This was the first sign of a trend reversal from down to up after 12 yrs. After the breakout, the price retested the pattern breakout zone and NOW again showing uptick, which is offering the best opportunity to capture the newly emerged rally.
Weekly: (Fibonacci + RSI)
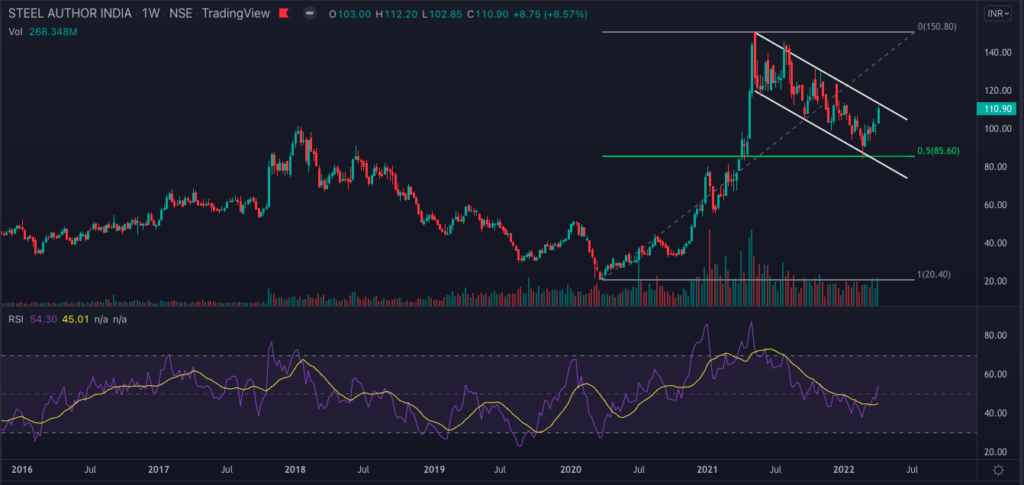
After a massive positive rally, the price cooled off a bit. Volumes in uptick were pretty high compared to downtick. Price ended up forming a down channel. Recent price reversal is right from the 50% retracement zone (as per the Fibonacci Ratio) and the Relative Strength Index has decisively crossed the 50 zone on the higher side and volumes are also picking up. RSI, being a leading indicator, has shown super strength and price is likely to follow the same direction : )
Daily: price action
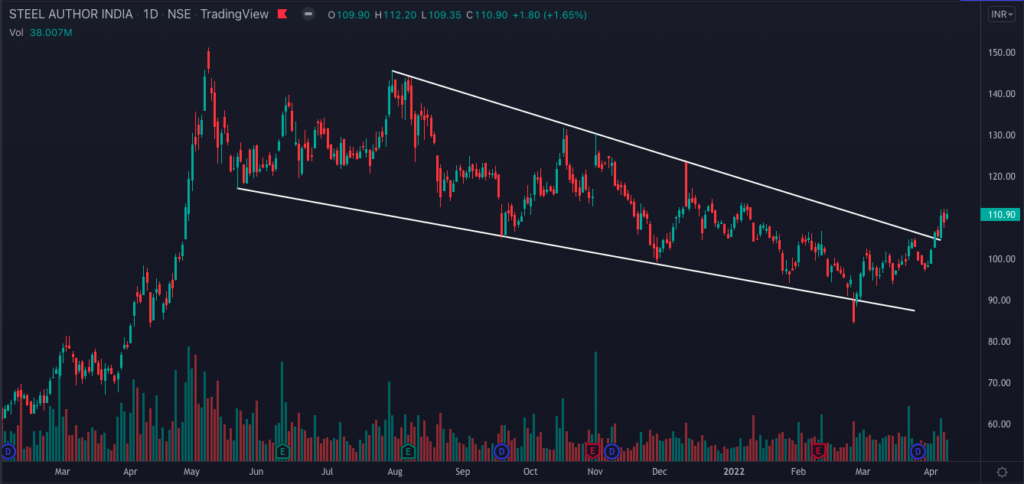
A prolonged downtrend on the daily chart seems to have come to an end. Price broke above the resistance line of Falling wedge a couple of days back, retested and continued uptick with good volumes. This confirms the first sign of trend reversal from down to up. If we just focus on the last price action, it also shows inverse H&S, which is also supporting bullishness.
Daily: Ichimoku
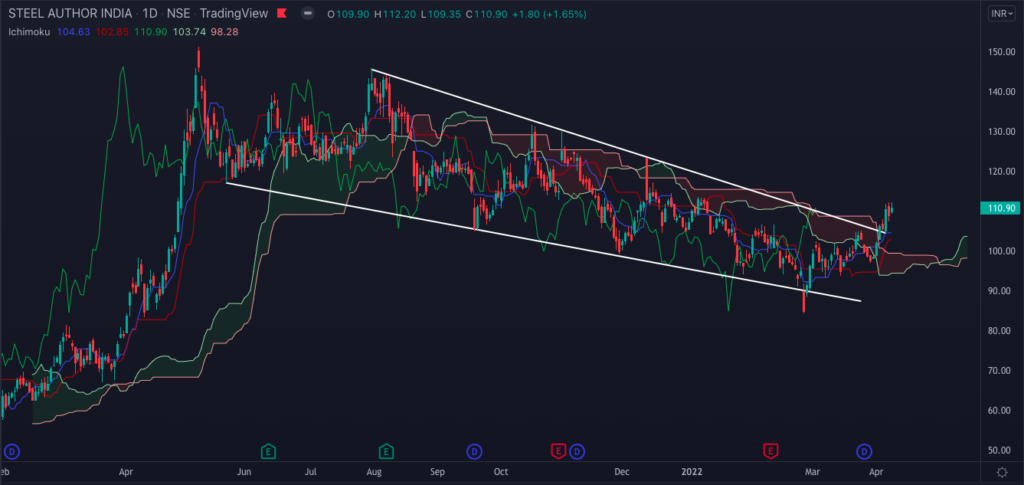
During this entire downtrend, the Ichimoku Cloud was also offering constant resistance. Decisive breakout of cloud alongside Tenkan – Kijun Crossover, future positive cloud and Chikou span above the resistance line, ALL confirming a likely emergence of a bullish trend.
Daily: MACD
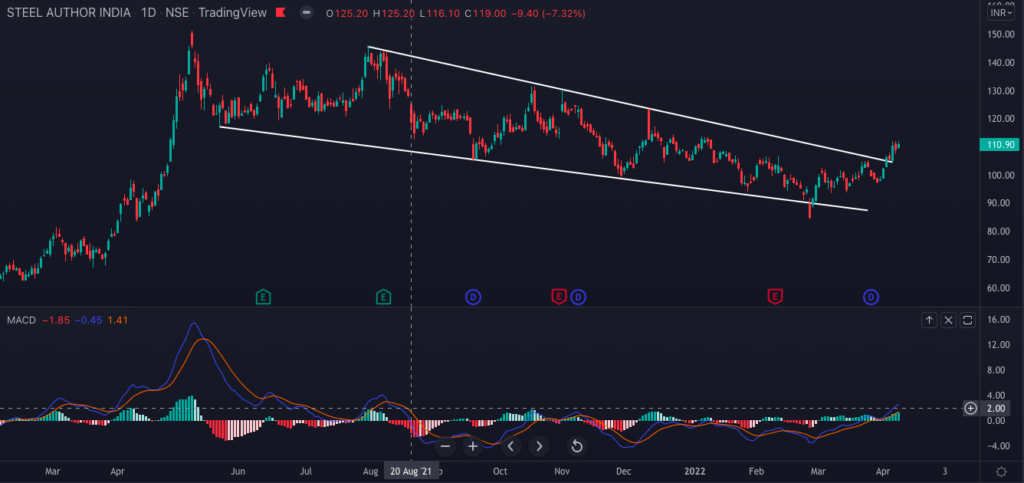
Negative MACD Crossover and MACD below zero line during the end of August 2021 confirmed downtrend, which lasted for almost 7-8 mth. MACD (though being a lagging indicator) has confirmed bullish crossover alongside zero-line crossover, confirming a newly emerged trend.
Ratio chart: SAIL with Nifty Metal
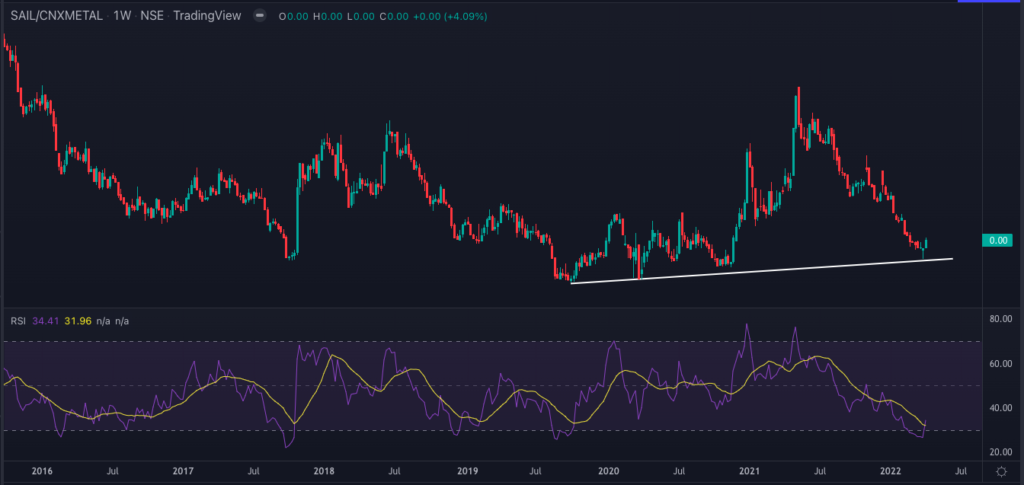
A ratio chart was clearly in the recent decline mode but halted right onto the support trendline. RSI coming out of an extremely oversold zone is just when the ratio chart is showing support, which aids SAIL’s likely outperformance view over Nifty Metal Index.
Ratio chart: SAIL and Tata Steel
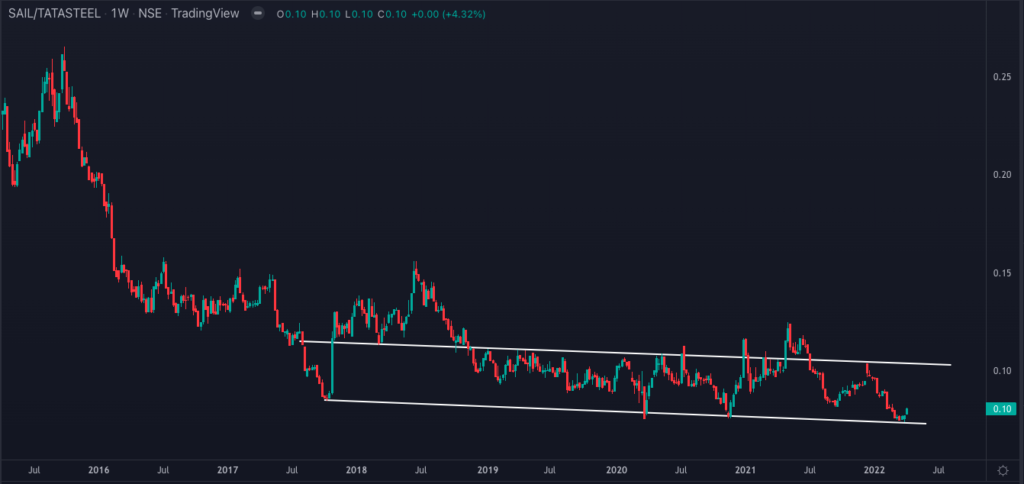
One more ratio chart of SAIL and Tata Steel is plotted. More or less, the ratio chart has remained in channel formation. It is bouncing right from the lows of the channel, which is supporting a bullish view (outperformance) of SAIL over Tata Steel.
Putting it all together
Considering formations and observations on monthly chart’s falling expanding wedge breakout and retesting, weekly RSI reversal and price bounce from 50% of retracement, daily chart’s falling wedge formation alongside Ichimoku and MACD is supporting a bullish view. Ratio charts of SAIL with Nifty Metal Index and Tata Steel are supporting its outperformance in the time to come. One can consider this as a good mid-term bullish bet.
Statutory disclosure: Kindly note that this update is only for educational purposes. It is safe to assume that my personal position, my fund’s position, my client’s position and my relative’s position may be open in the counter. Prefer to take the advice of your financial advisor before initiating any position.

- Avenue Supermarts: Is Dmart Providing Shopping Opportunities for Portfolios? - Mar 29, 2023
- GMR Airport Infra: Counter on Runway To Fly Soon! - Mar 21, 2023
- SW Solar: Is The Counter A Good Bet From Long-Term Perspective? - Mar 14, 2023

