Last Updated on Apr 25, 2022 by Aradhana Gotur
Harsh Vora is a proprietary investor and day trader with more than 10 yrs of experience in financial markets and is interviewed on ET NOW.
The benchmark Nifty50, after correcting almost 15.6% from the all-time high of 18,600 reached in October 2021, has recovered as much as 10% from the recent low of 15,670 levels.
What’s encouraging is that the recovery from lows happened in just two weeks. It is now only 8% away from the all-time high.
The recovery was underpinned by a meaningful reduction in the outflows by foreign institutional investors (FIIs) – from selling Rs. 8,000 cr. worth of equities on 8 March, the FIIs have turned into net buyers, lapping up as much as Rs. 2,800 cr. worth of equities on 17 March. Note that this level of buying was not seen since at least January of this year.
How does the market look now?
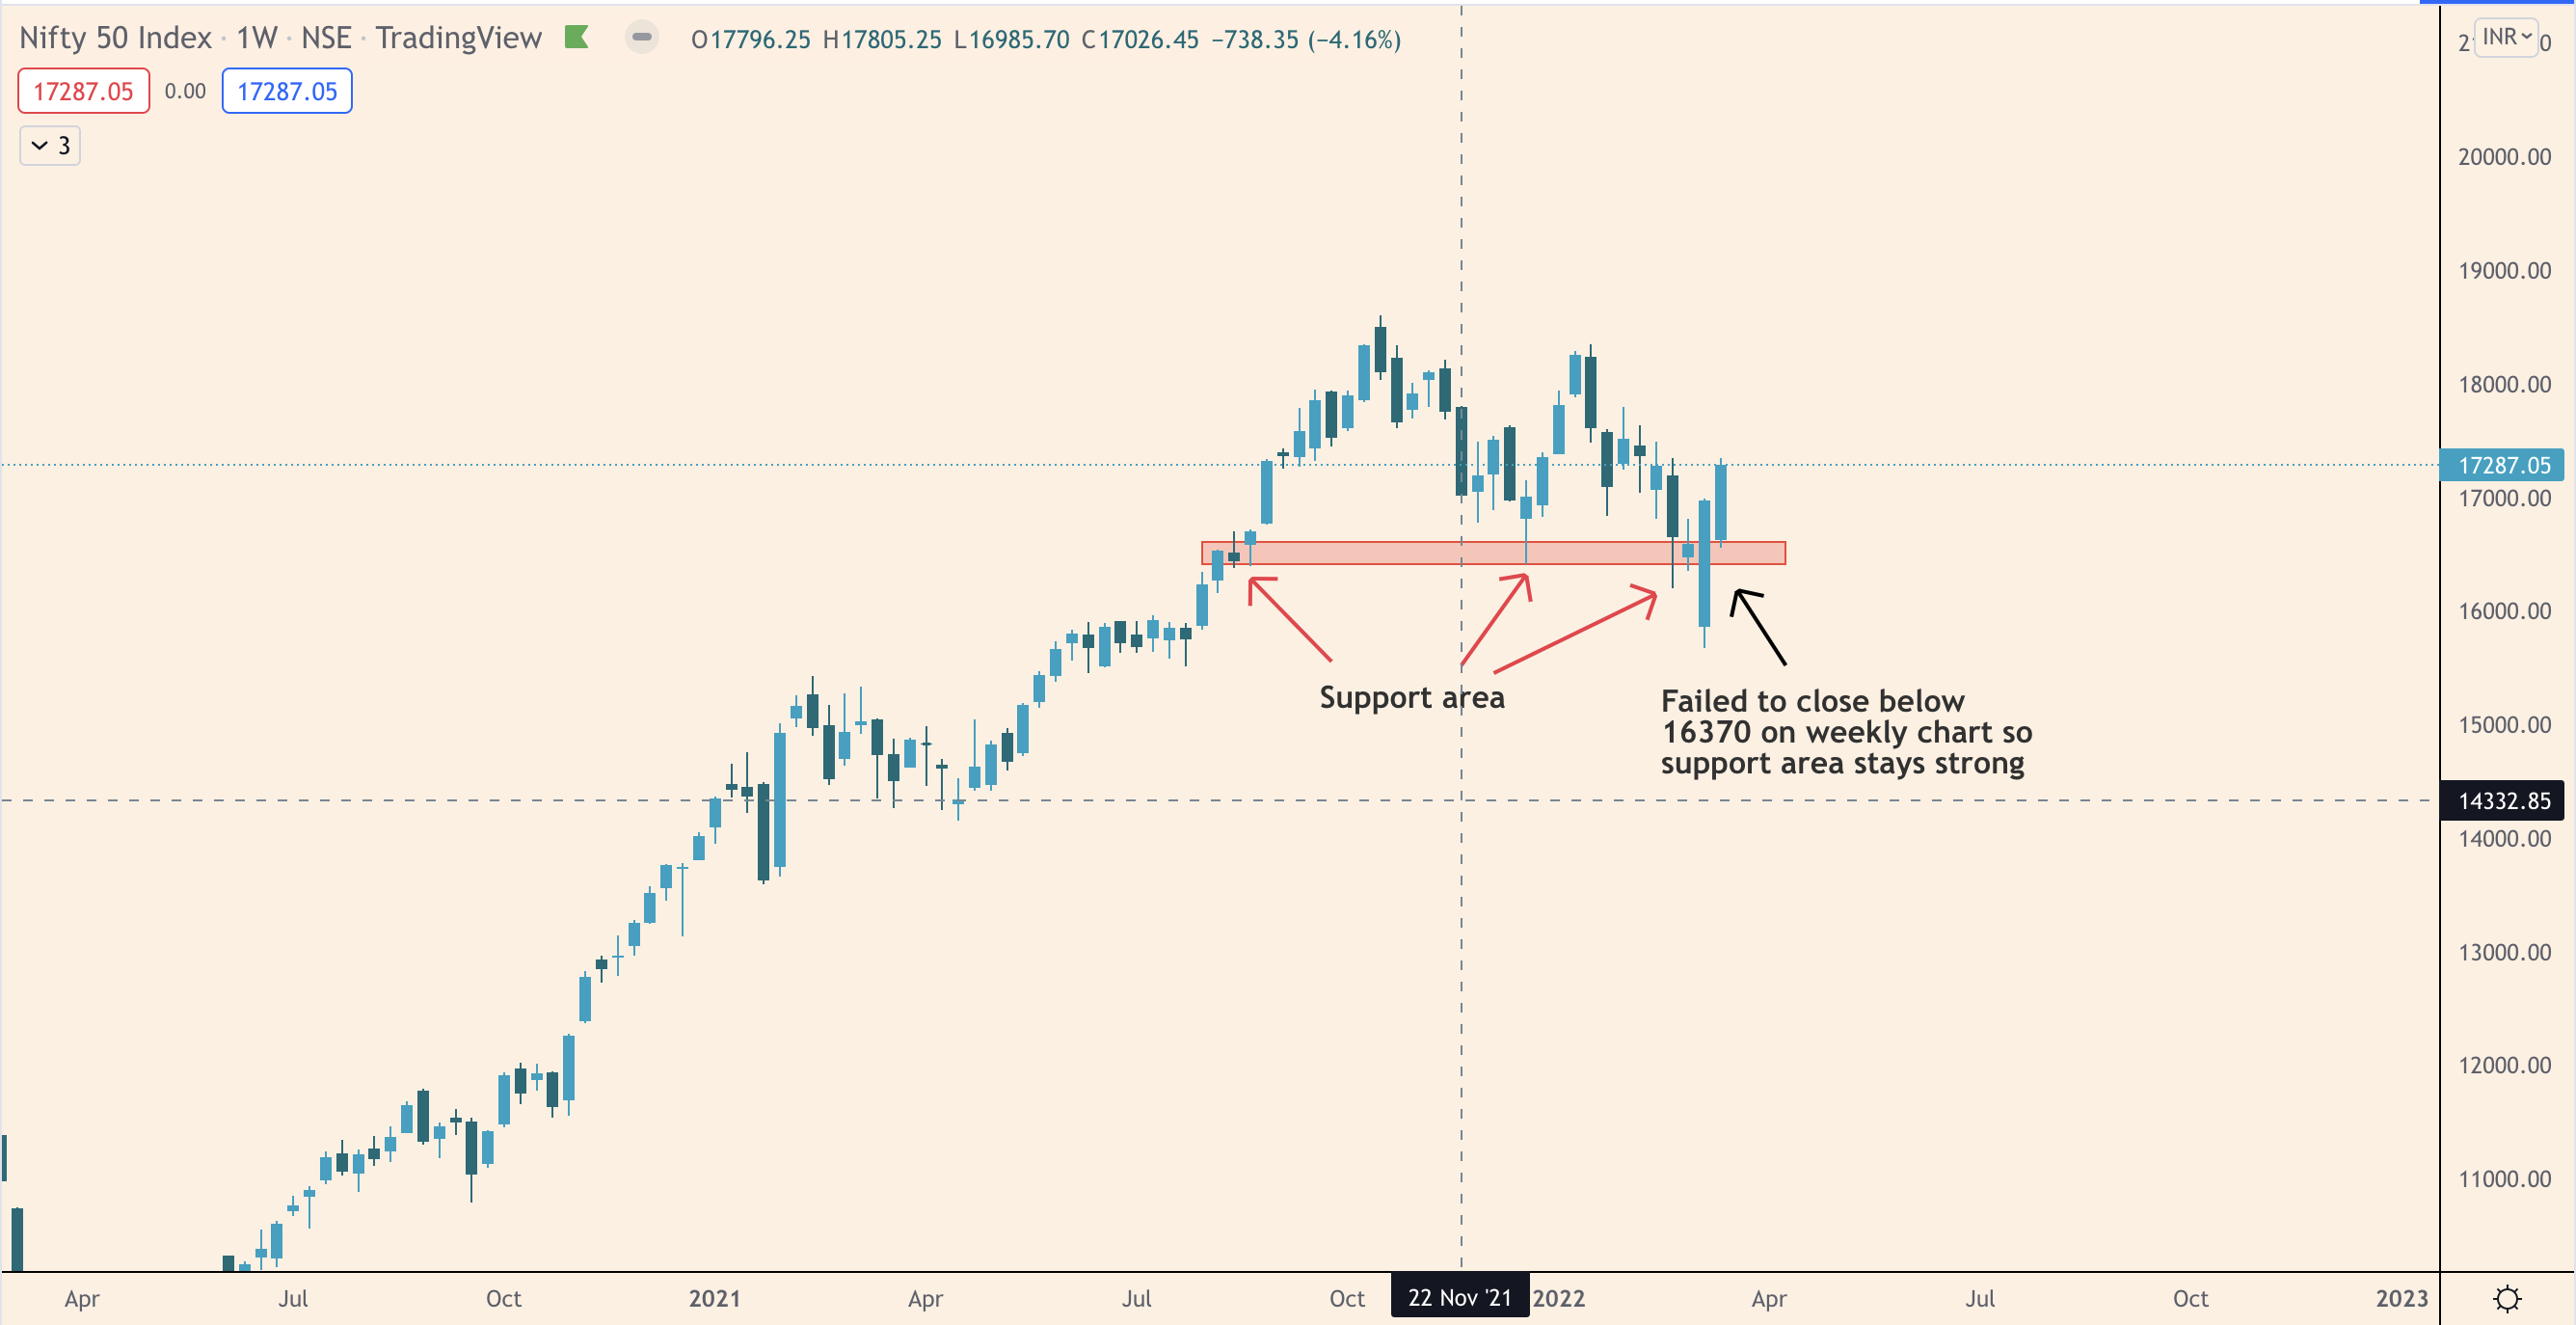
In the weekly chart of Nifty50 seen below, we notice that the index took strong support at 16,370 levels in the past two weeks. Note that this level had acted as support twice earlier, and in the past two weeks, buyers successfully prevented Nifty from closing below it. A decisive close below this level would have meant a continuation of the downside, possibly to 15,400 levels.
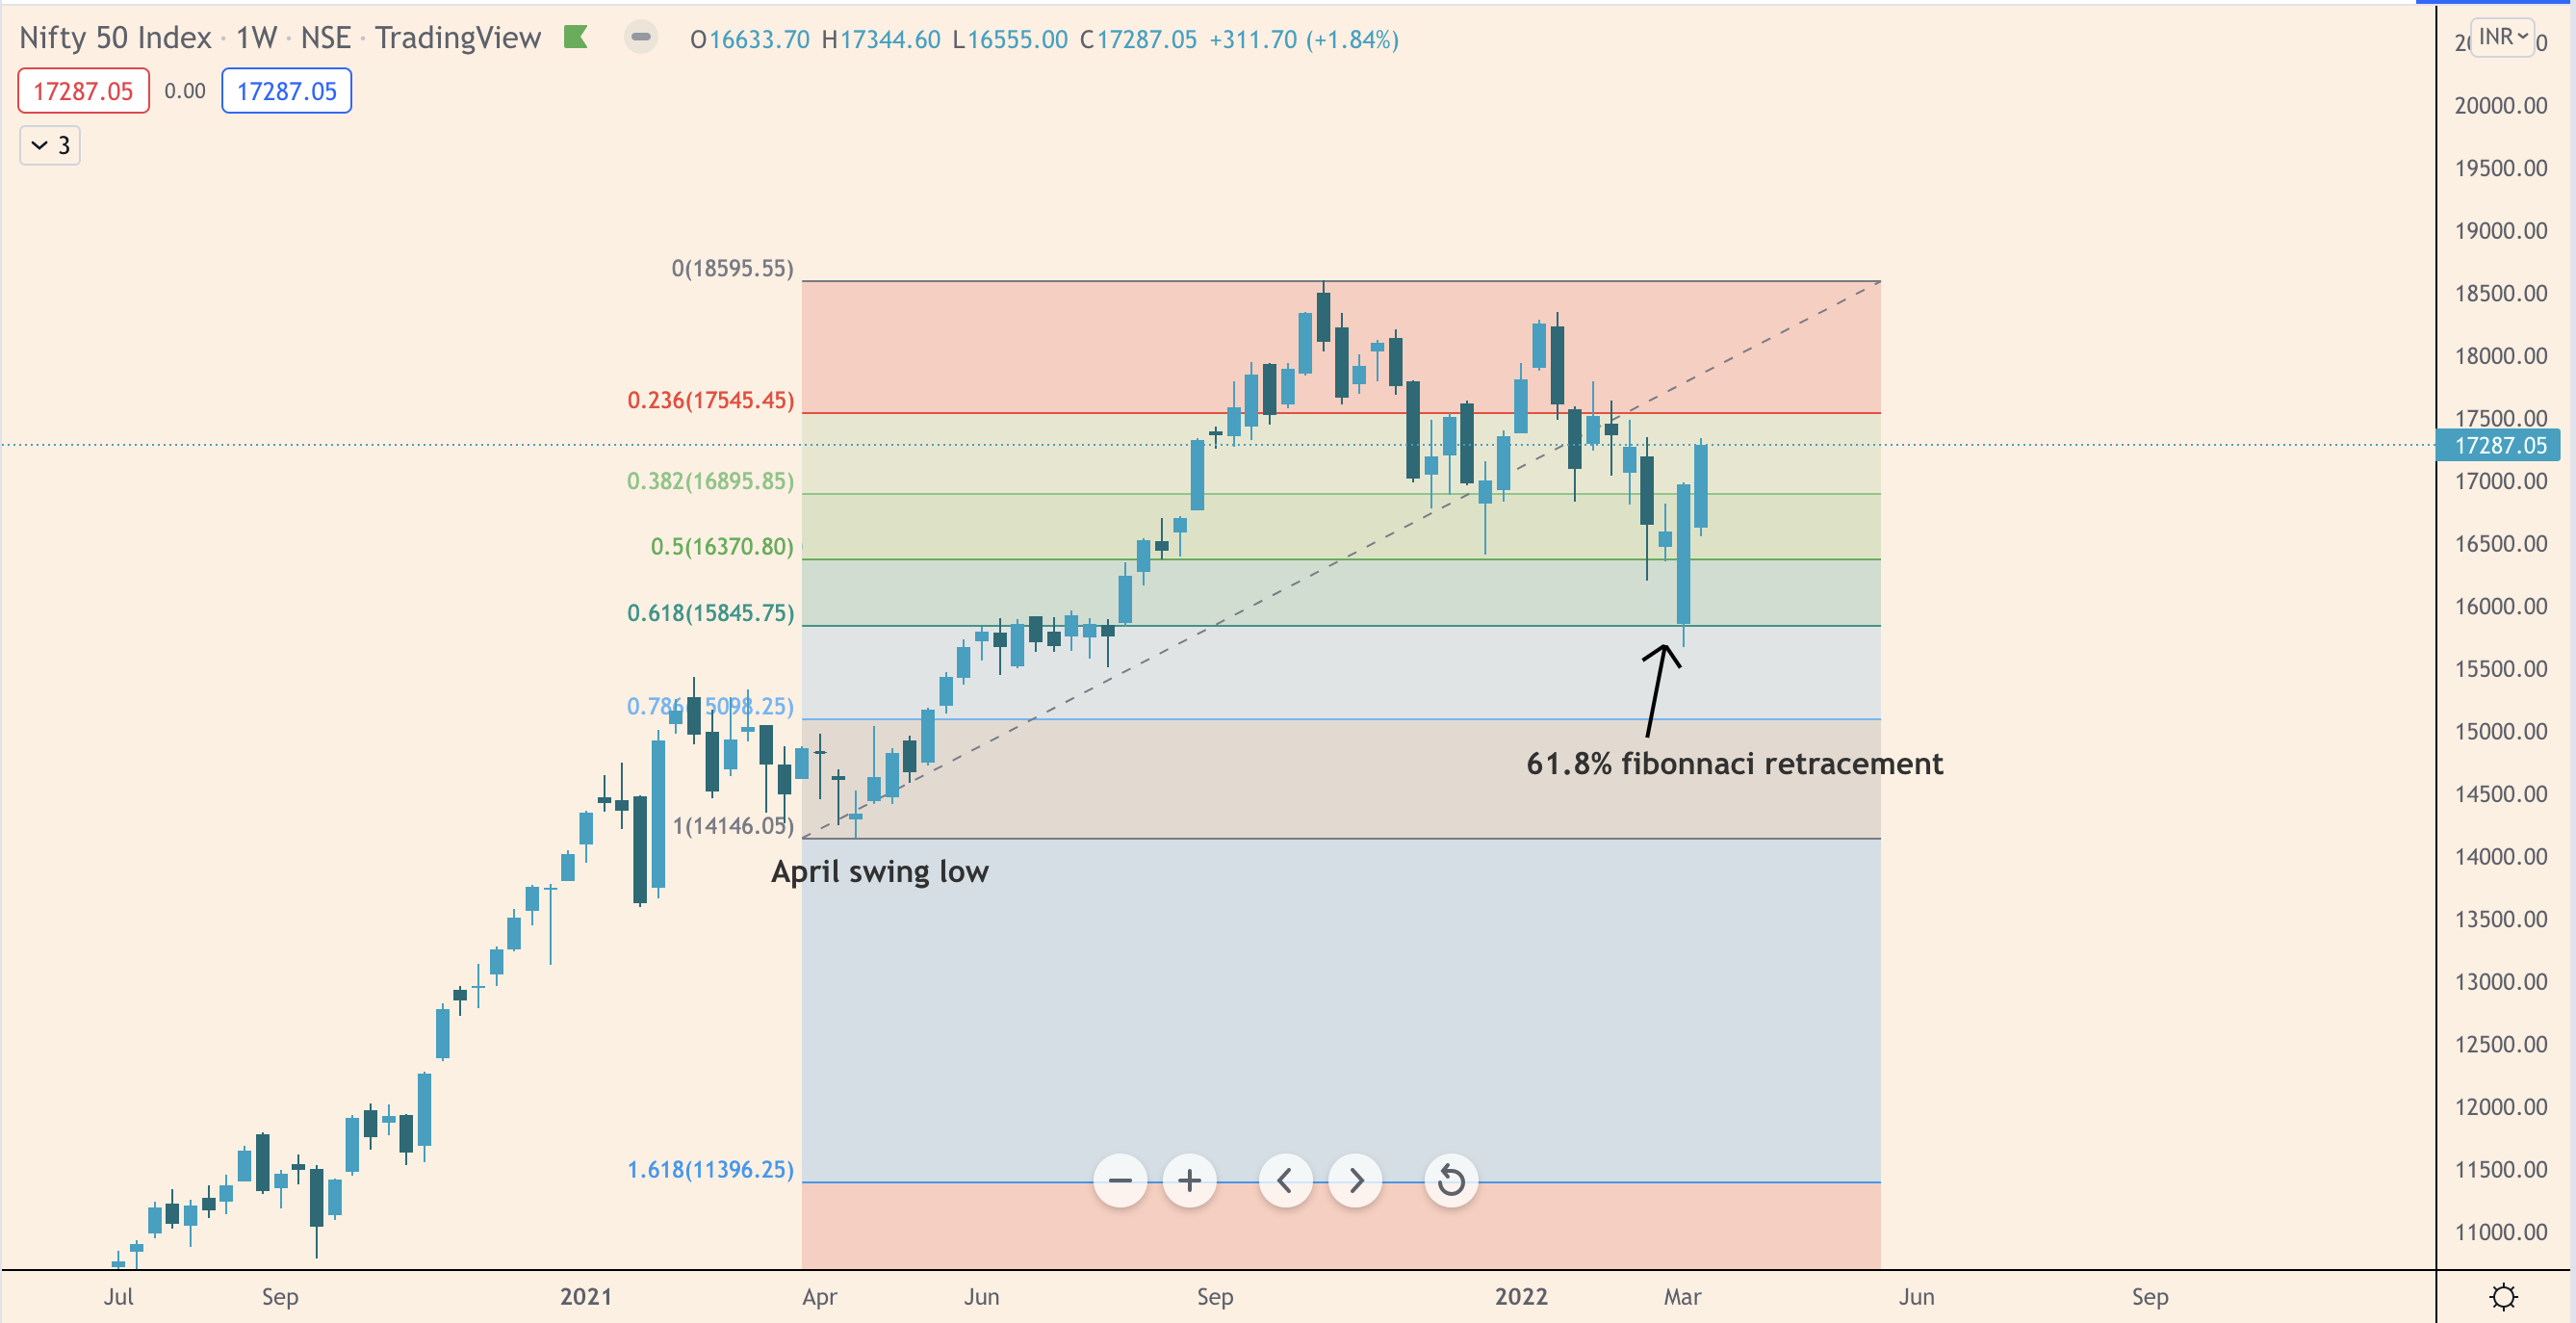
Another strong support area, where buyers appeared strongly in the past two weeks and prevented the market from closing below 16,370 levels, was 15,670 levels. As you may notice in the chart below, this was also 61.8% Fibonacci retracement level – popularly known as the golden ratio – when drawn from April 2021’s swing low (see the chart below). Note that the market had previously taken support here in July 2021 as well.
And so, this support is likely to remain strong going forward.
Can we say that the market sentiment has now turned bullish?
Not yet.
Why? Do remember that as per Dow Theory, for a trend reversal to be established, the price must close firmly above the previous swing high.
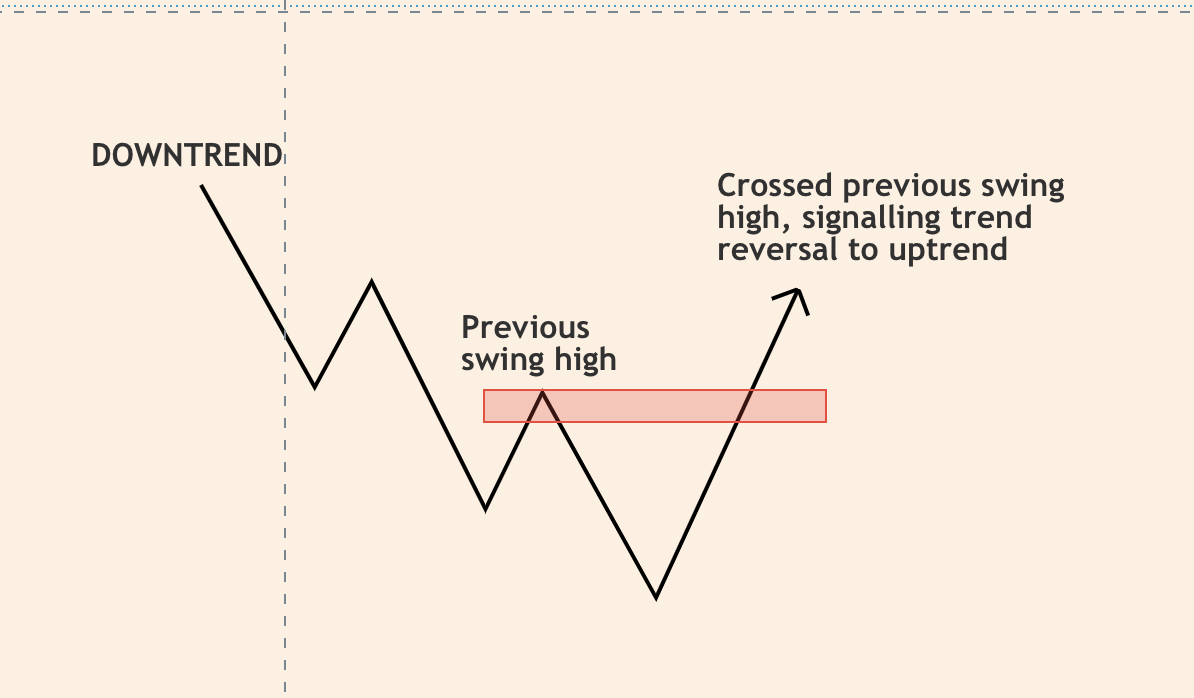
As you may notice in the chart below, the market has not yet crossed above the previous “lower high” (marked in the chart below) at 17,794. In other words, Nifty is still in “lower-high, lower-low” formation on the weekly chart, which means it is in a downtrend.
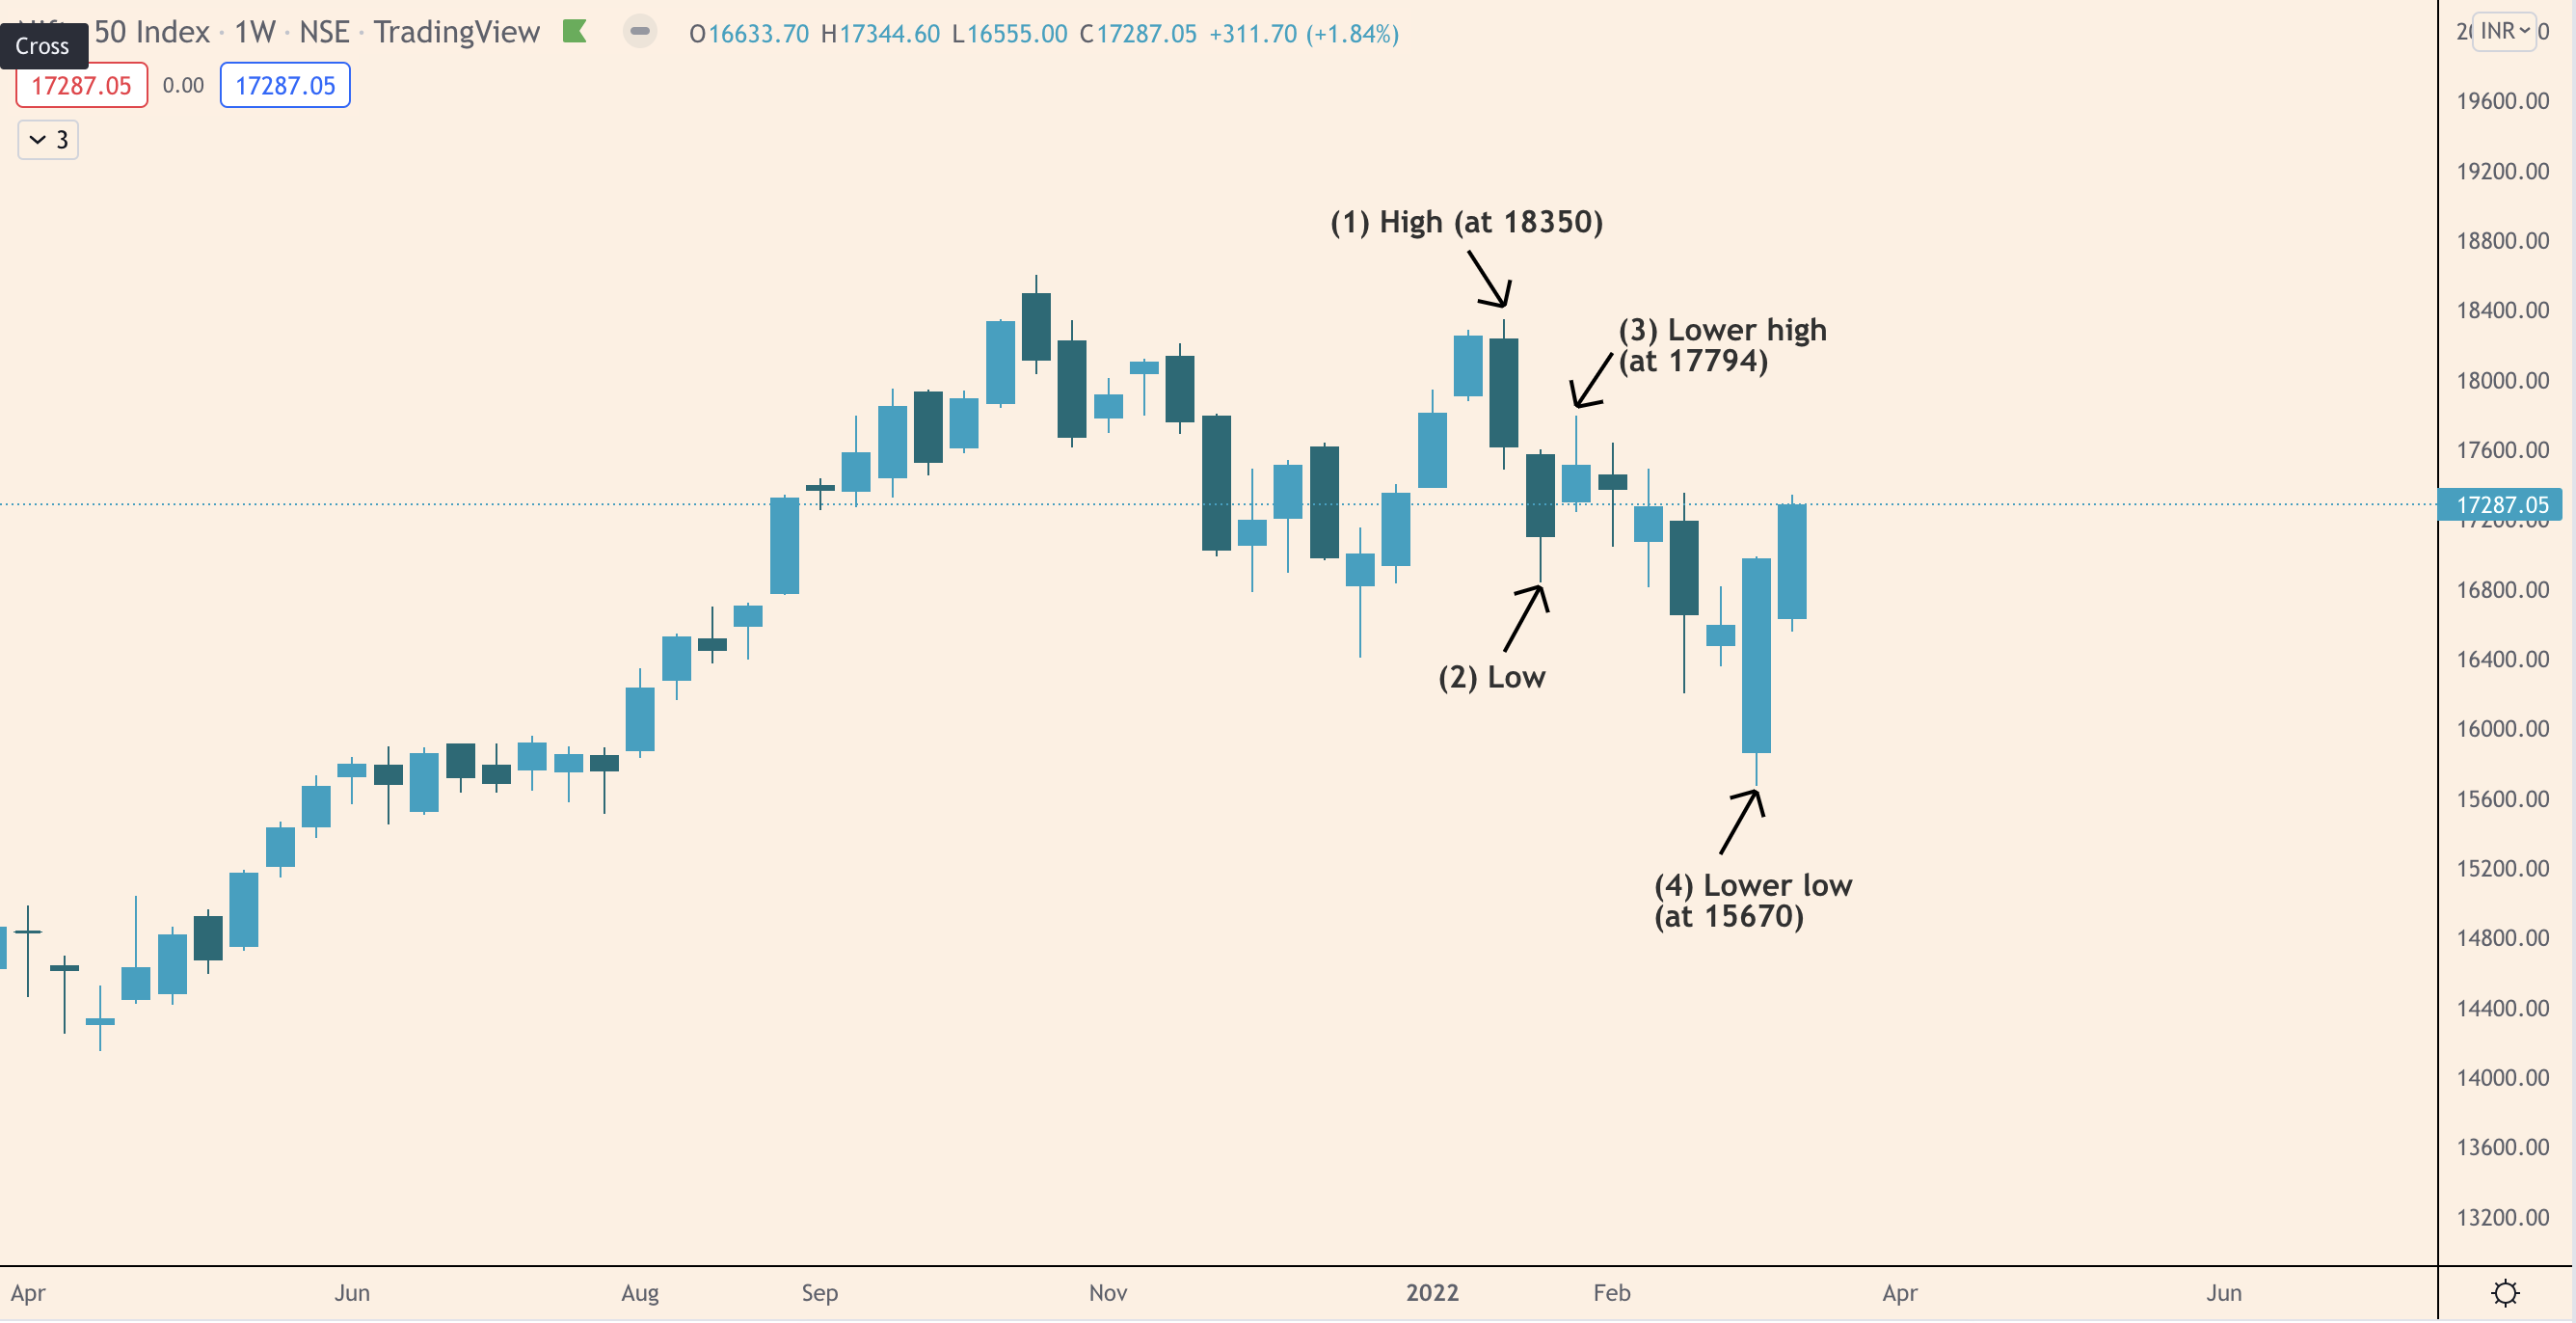
Nifty will only be considered in an uptrend when the “lower high” is breached on the weekly timeframe. For this, Nifty has to close strongly above the lower high on the weekly chart. Even so, do note that there are two more resistance levels immediately above at 18,350 and 18,600 levels, failing to close above which the market could continue its downtrend.
Fundamentally speaking, inflation data remains a threat to global growth and may continue to keep Indian markets under pressure.
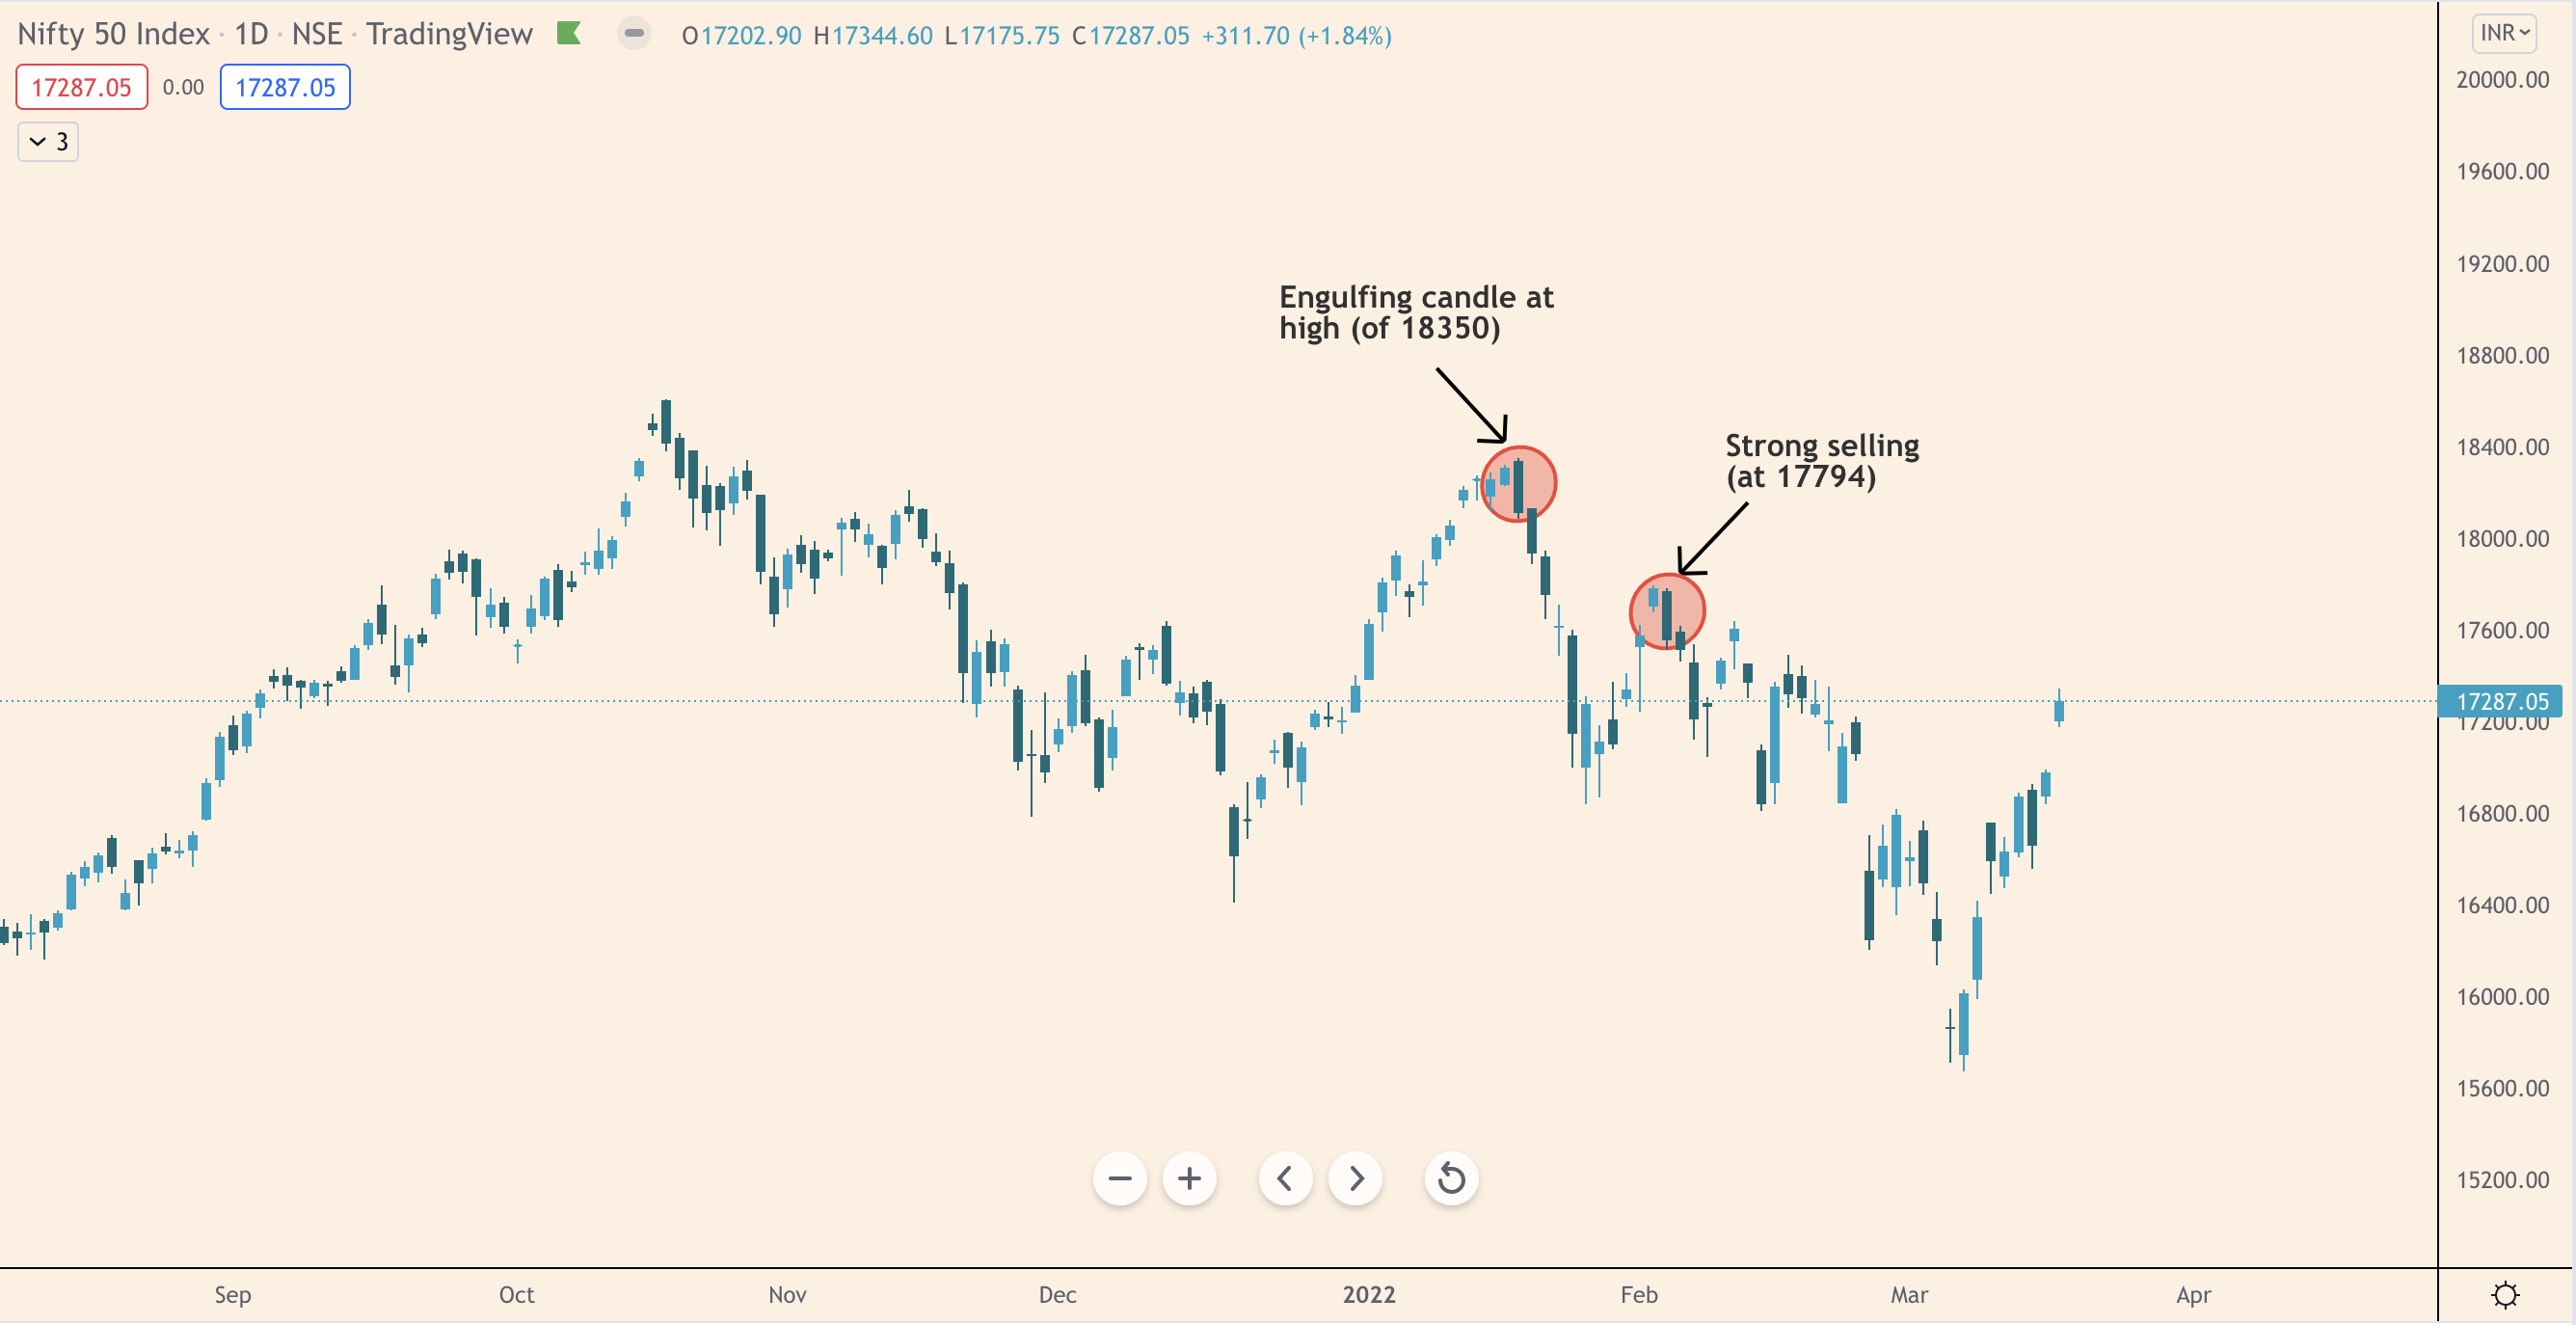
On the daily chart, note that these levels – 17,794 and 18,350 – are also marked by “engulfing candles”, which means the sellers were strong at these levels (see chart below). It is crucial for the market to close strongly above these levels for an uptrend to be established firmly.
What is encouraging on the daily chart, however, is that the market is above the 9-day exponential moving average (black line) and sustaining there. It is also on a “higher-high, higher-low” formation, which implies an uptrend.
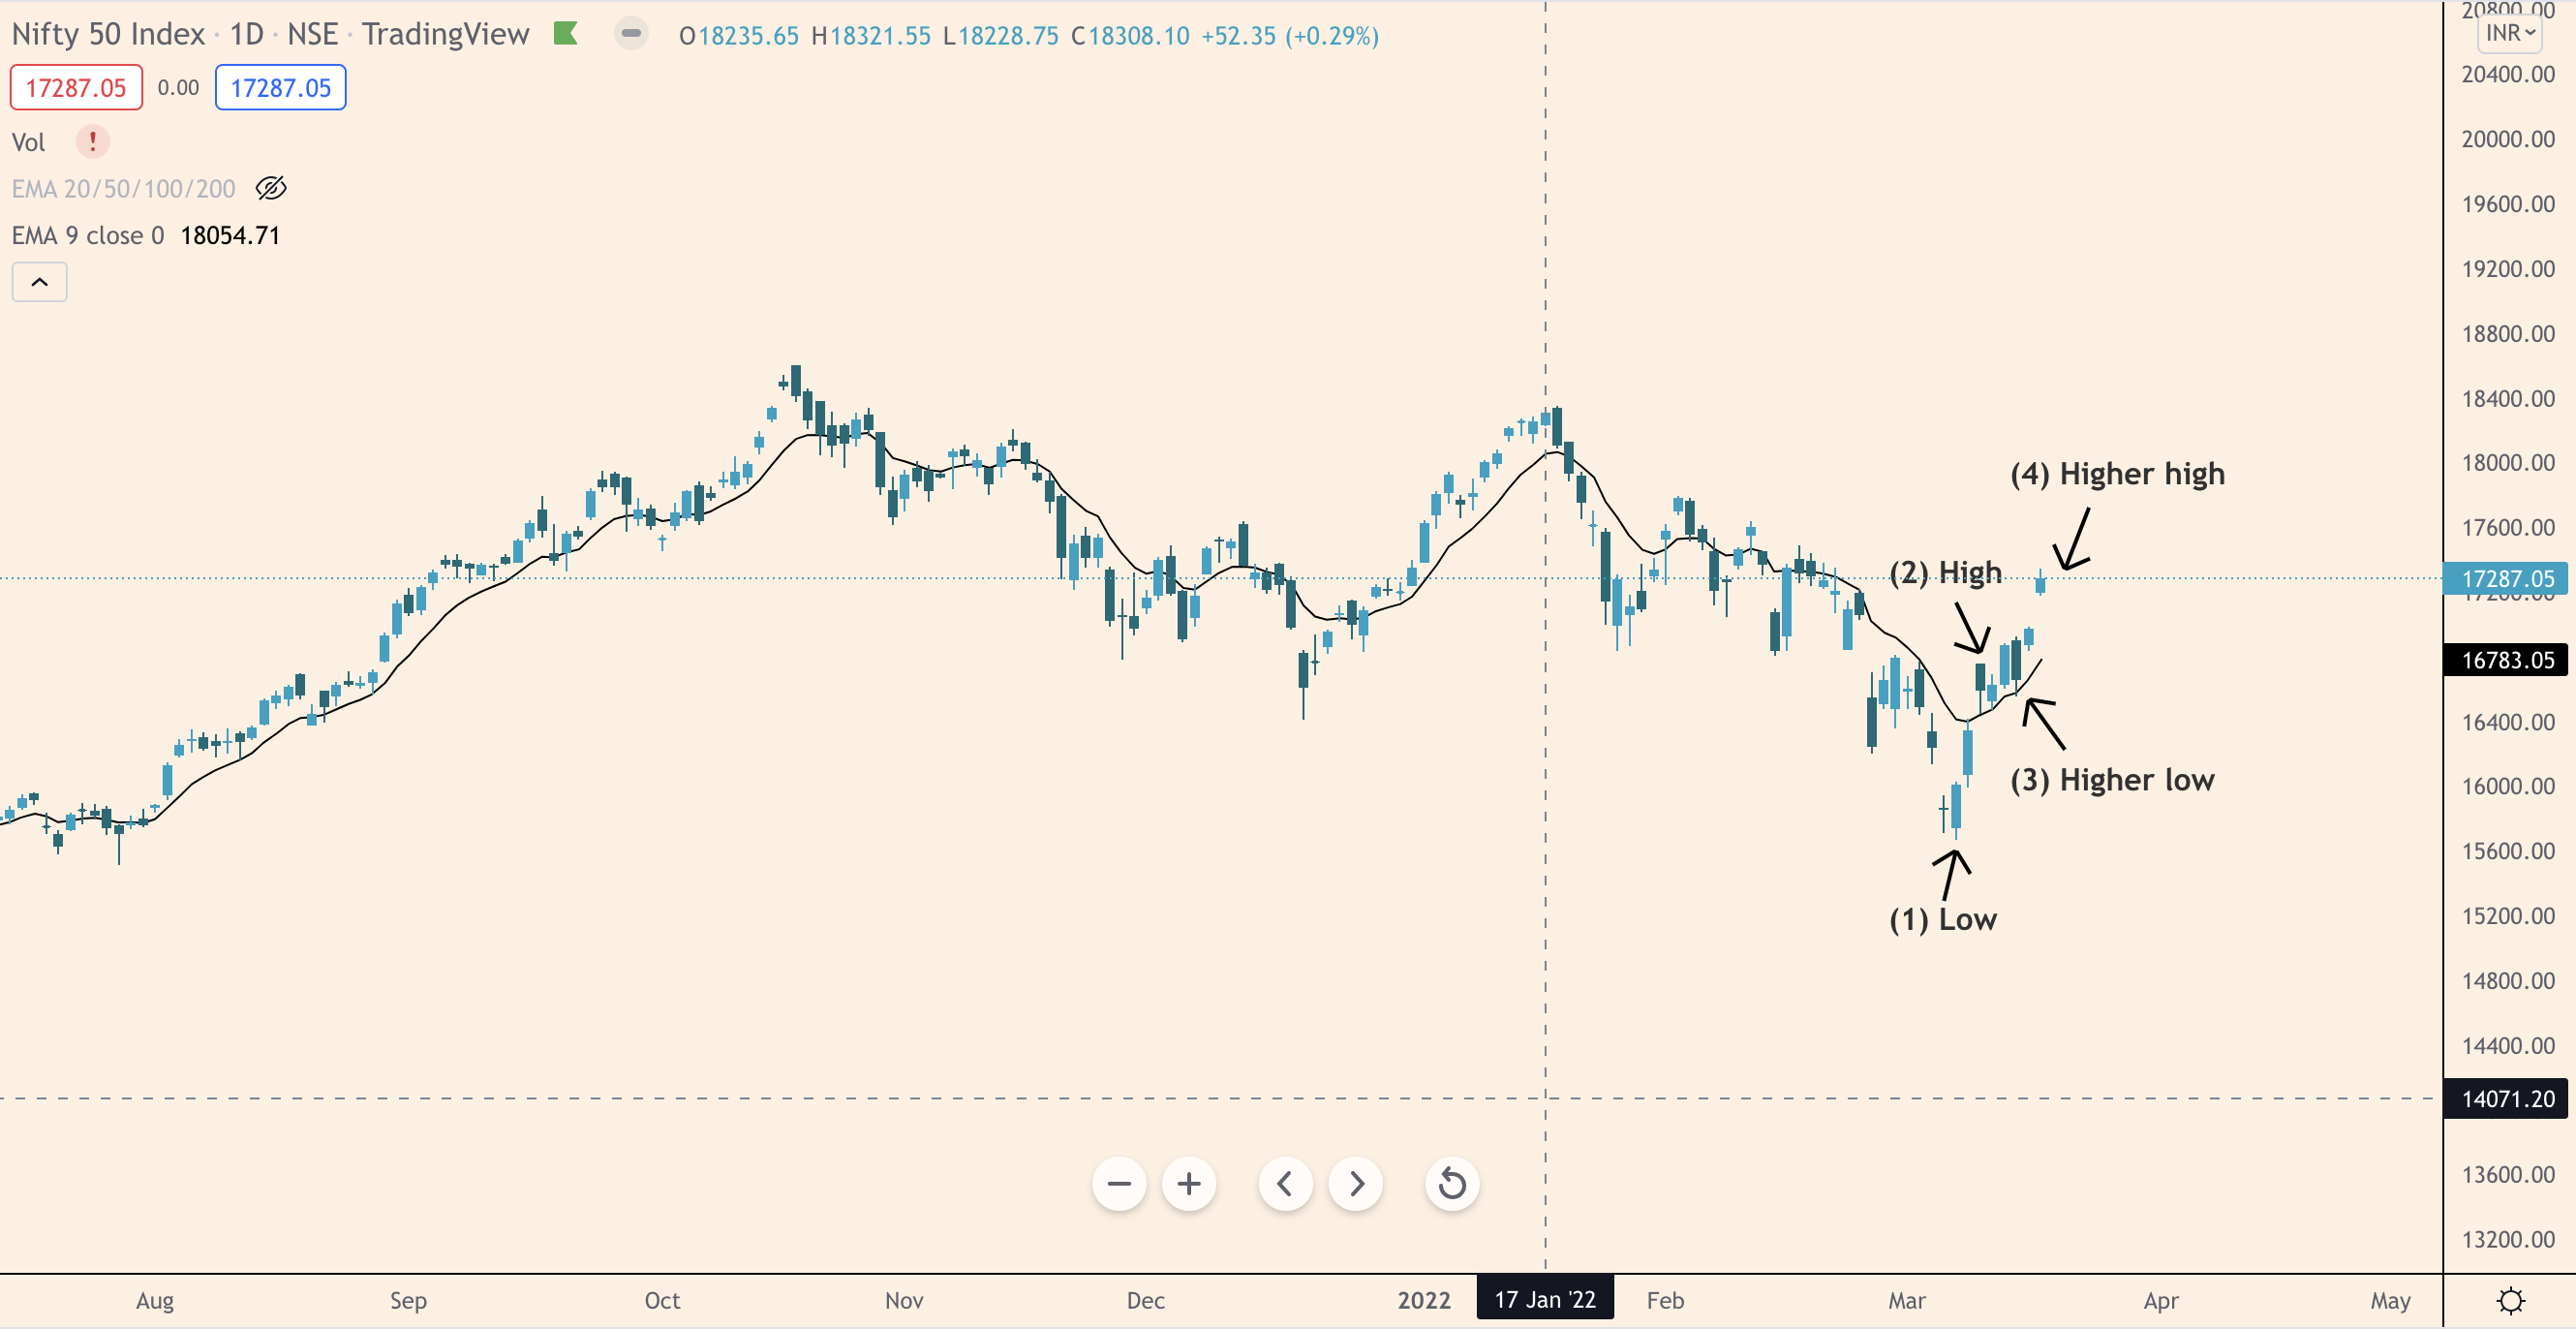
To sum up, though Nifty50 has taken strong support at 15,670-16,370 levels and is now showing encouraging price action (higher high, higher low formation) on the daily chart, the broader downtrend has not been negated (yet) on the weekly chart. In other words, it is too early to call it a trend reversal. The resistance areas of 17,794, 18,350, and 18,600 are key levels to watch out.