

Last Updated on Jan 12, 2023 by Anjali Chourasiya
Analysing financial statements is a great way to assess a company’s performance. It is a vital step in the fundamental analysis methodology. But, among many financial statements and ways available to gauge the performance of a company, how do you decide which one to pick? In this article, let’s explore financial statement analysis in detail, along with its tools, objectives, advantages, and limitations.
Table of Contents
What is financial statement analysis?
To make an informed decision about a company, you must analyse its financial statements. This process is referred to as financial statement analysis. It provides insights into a company’s health. Financial statement analysis involves looking at trend lines of key items in the statements over a period of time and financial ratio analysis.
Objectives of financial statement analysis
Future decision making
To predict future prospects, the past performance of a company is analysed. It is done using various elements present in the financial statements, such as profitability, cash flows, return on investment, operating expenses, etc.
Know the current position of a company
It is important to know the current position of a company, and it is done through financial statement analysis. Knowing the current position of a company helps in comparing and understanding the trend of the company operations. It gives a clear picture of a company’s performance.
Eliminate discrepancies
Any company records each and every transaction in the statements. It helps them depict the financial position of the company, decide the areas of improvement, and make efficient decisions to avoid any discrepancies.
Reduces the chances of fraud
One of the objectives of financial statement analysis is to reduce the chances of fraud. You might have heard of scams companies fall prey to and cases like money laundering. Hence, when there is a proper record of every transaction, it becomes easy to prevent such situations.
Types of financial statement
Income Statement
It is the profit and loss statement of a company. It is commonly referred to as the income statement, operation statement, earnings statement, or P&L statement. The income statement consists of –
- Tax and depreciation
- The revenue of the company for a certain time period (quarterly or yearly)
- The Earnings Per Share (EPS) number
- The expenses incurred to generate the revenues
The income statement gives you an insight into a company’s profitability. It helps in articulating the company’s bottom line. The P&L statement has a lot of parameters. Depending on the industry, different parameters are measured. However, there are three main parameters that can be measured for all companies to check their profitability. These are revenue, Profit Before Interest and Tax (PBIT), and net income.
For a successful company, these three factors should always appreciate. After analysing these three factors, you can also analyse the trend in net profit for the last 5-10 yrs and operating profit to have a deeper understanding of the income statement.
Balance Sheet
To determine if a company is worth investing in, you can look at the total assets and total liabilities of the company. This can be done with the help of a balance sheet.
The balance sheet got its name from the requirement that at any time, the total assets of a company should always be equal to the company’s liabilities, including shareholder’s equity. In case it is not balanced, it reflects some issues like incorrect or misplaced data, miscalculations, or exchange rate or inventory errors. Hence, in a balance sheet,
Assets = Liabilities + Shareholders’ Equity
You can mark a company as ‘good for further analysis’ when its assets are higher than its liabilities. But if the liabilities are higher, it is usually considered ‘not worth investing’. For a deeper analysis, various financial ratios like debt to equity ratio, returns on equity, etc., are used.
Cash-Flow Statement
To understand the movement of money in and out of business, a cash-flow statement is used. It determines a company’s financial health and helps you analyse its liquidity. The cash-flow statement shows the net change in cash. It is usually divided into cash from operating activities, investing activities and financing activities.
To analyse a company’s cash flow statement, look for the parameter ‘Free Cash Flow’. This is indicated in positive and negative numbers, where a positive cash flow represents that the company’s assets are growing. However, a negative cash flow indicates otherwise.
With Tickertape, it is easy to check all the financial statements in one place. Enter the company you wish to analyse using the search bar on Home Page. Select the stock, and click on the ‘Financial Statements’ tab. You will find income statements, balance sheets and cash flow statements there. You can view them in ‘Normal View’ and ‘Growth View’. Explore now!
Techniques of financial statement analysis
There are five ways analysis and interpretation of financial statements can be done. Let’s look at each one of them.
- Horizontal analysis
This type of analysis compares historical data and identifies a trend over time. In horizontal analysis, as the name suggests, you pick one parameter and look for its data over time in the horizontal row. Hence, it is always depicted as a percentage growth over a period of time for any parameter. For example, in the below-mentioned income statement, if you want to analyse total revenue for the last 3 yrs, you look at the Total Revenue row horizontally, compare yearly data, and deduct the conclusions.
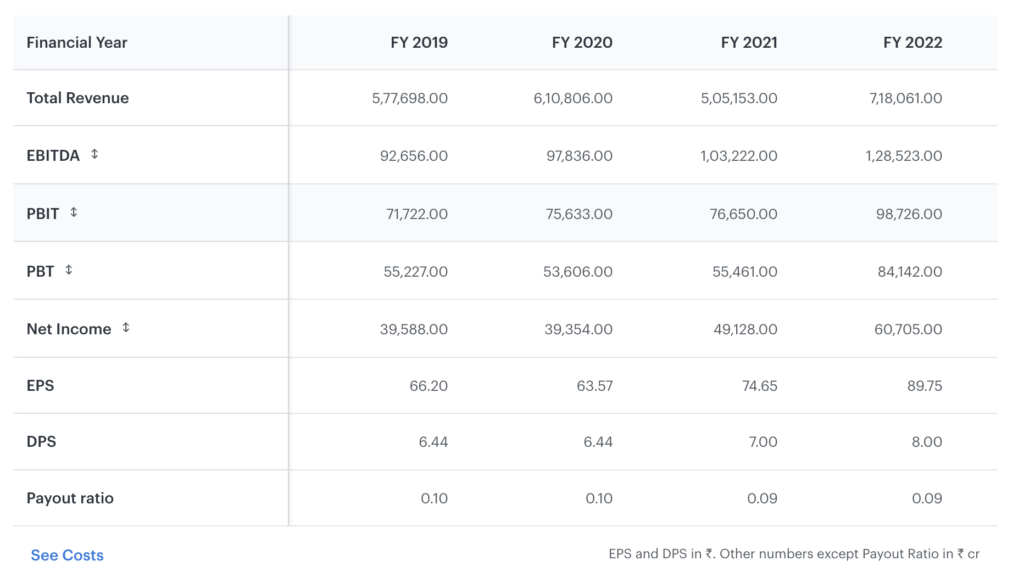
Horizontal analysis allows you to spot growth patterns and forecast future projections. It allows you to look into the profitability of a company by comparing historical data and makes it easier to compare growth rates amongst sector competitors.
- Vertical analysis
In contrast to horizontal analysis, vertical analysis looks at one column of a financial statement. It allows you to check the parameters in relation to each other and provides an overall understanding of a company’s financials in terms of revenue and expenses.
For example, an income statement might have all the items listed as a percentage of gross sales, whereas every line item on a balance sheet is stated as a percentage of total assets.
- Ratio analysis
If you want to obtain a quick overview of a company’s financial health and the granular relationship between different parameters present in multiple financial statements, then ratio analysis is for you. It gives meaningful comparisons between various elements of financial statements and is used to determine upward or downward trends. After the data is obtained, it is compared with past performance and competitors to get an idea about the company’s financial health.
There are five types of ratios. Let’s understand them in brief.
- Liquidity ratios
When a company is unable to pay its debt due to financial difficulties, it has the option to use its assets to settle debt with more ease. You can find if a company is capable of doing this using liquidity ratios. They measure a company’s ability to meet its debt obligations using its current assets. Some common liquidity ratios are the current ratio, the cash ratio, and the quick ratio. These ratios are usually used by banks and creditors to determine if a client has the ability to fulfil their obligations on time.
- Solvency ratios
Often referred to as leverage ratios, solvency ratios measure a company’s ability to sustain its day-to-day operations in the long term. It measures a company’s financial health by determining its ability to meet its long-term debt obligation. The most common solvency ratios are the interest coverage ratio and debt-to-equity ratio. They are mostly used by the government, employees, banks, and institutional investors.
Also known as market prospect ratios, valuation ratios help investors understand their return on investment for a specific investment. The earnings can be in the form of dividends or higher stock value.
Valuation ratios measure a company’s worth. It analyses whether a company’s current share price is perceived as its true value. Valuation ratios compare the cost of security with the perks of owning the stock. Some valuation ratios include Price-to-Earnings Ratio (P/E ratio), dividend yield, payout ratio, and Earnings Per Share (EPS).
- Efficiency ratios
Efficiency ratios measure a company’s ability to manage its resources effectively. These ratios are commonly used in financial statement analysis to assess a company’s operational efficiency and performance. Usually, when there is an improvement in efficiency ratios, the business stands to generate more revenues and profits.
Some examples of efficiency ratios are payables turnover, working capital turnover, fixed assets turnover, asset turnover, inventory turnover, and receivables turnover ratio.
- Profitability ratios
To determine the profitability of a company, profitability ratios are utilised. They reveal the performance of a company in terms of generating profits. They also convey the competitiveness of the management.
- Trend analysis
A technique that utilises historical data, such as price movements and trade volume, to predict the future direction of market sentiment is known as trend analysis. By examining past patterns, it aims to anticipate upward trends and reversals within specific market segments, enabling businesses to better plan and prepare for potential changes.
The advantages of using trend analysis can be many. Two of them are –
- It can help in identifying opportunities for buying and selling securities.
- It can provide insight into market psychology and momentum.
However, if the data is inaccurate, incomplete, or flawed, the analysis can be inaccurate and may mislead. If used correctly, trend analysis can be a helpful technique as moving along with trends and not against them may result in profit for investors.
To know the current mood of the market, if it is greedy or fearful, use Tickertape’s Market Mood Index. It helps you time your investments better. Learn more about this tool here. And if you want to check it out, click here.

- Cost volume profit analysis
Cost-volume-profit (CVP) analysis is a method used to determine how changes in costs, volume, and prices affect a company’s profit. It’s a tool that helps managers make decisions by identifying the relationship between changes in costs, revenue, and profit. CVP analysis involves analysing the relationship between a company’s revenue, variable costs, fixed costs, and the volume of products or services sold.
The goal of this technique is to identify the break-even point (the point at which revenue equals costs) and to determine how changes in costs, volume, and prices will affect a company’s profit. By understanding this relationship, managers can make better decisions about pricing, production, and other factors that affect the company’s bottom line.
Advantages of financial statement analysis
There are several advantages of financial statement analysis, including:
- Assessing performance: Financial statement analysis can be used to assess a company’s past and current performance, as well as its potential for future growth.
- Identifying trends: By analysing financial statements over time, it is possible to identify trends in a company’s financial performance, such as increasing or decreasing revenues, profits, or liabilities.
- Benchmarking: The technique can be used to compare a company’s performance to that of its competitors or to industry averages.
- Detecting potential issues: Financial statement analysis can help to identify potential issues, such as high levels of debt or liquidity problems, that may affect a company’s ability to meet its financial obligations.
- Supporting decision-making: Financial statement analysis provides useful information that can be used to make informed decisions about investing in or lending to a company.
- Risk Management and mitigation: The technique helps in assessing if a company can complete its debt obligations. It enables the assessment of risk to loan or credit the firm, thus helping in the mitigation of risk.
What are the limitations of financial statement analysis?
Financial statement analysis is a helpful technique. However, there are several limitations to it, including,
- Limited usefulness of historical information: Financial statement analysis is based on historical data and may only sometimes be an accurate predictor of a company’s future performance. It mainly provides a historical perspective and does not reflect current or future events like economic conditions, competitor moves, natural disasters or other unforeseen events that can affect the company’s financial situation.
- Subjectivity: Financial statement analysis can be subjective, as different analysts may interpret financial statements differently.
- Lack of information: Financial statement analysis is limited in terms of information, such as it may need to provide more information to make an informed and comprehensive analysis. Hence, other sources such as industry reports, annual reports, research papers, news articles and expert opinions are necessary to make a more robust analysis.
- Assumptions: Many ratios and other financial statement analysis tools are based on certain assumptions, such as the consistency of accounting methods, which may only sometimes hold true.
- Inability to account for non-financial factors: Financial statements do not capture crucial non-financial information such as a company’s reputation, customer base, or strategic partnerships, which can also be critical to its success.
- Complexity: Analysis of financial statements is often complex and may require expertise and knowledge in accounting, finance and economics.
Tips for conducting accurate financial statement analysis
- Understand the accounting principles: It is essential to understand the accounting principles and methods used in the preparation of financial statements in order to interpret the information presented accurately.
- Use multiple years of financial statements: To accurately analyse a company’s performance, it is important to review multiple years of financial statements in order to identify trends and patterns.
- Use both absolute and relative figures: While absolute figures provide a snapshot of a company’s performance at a specific point in time, relative figures such as ratios and percentages help to identify trends and relationships between different financial data.
- Compare to industry averages: Comparing a company’s financial performance to industry averages can provide valuable insights and help to identify areas of strength and weakness.
- Use a variety of financial analysis tools: There are many financial analysis tools available, such as ratio analysis, trend analysis, and common-size financial statements. Using a variety of tools can provide a more comprehensive analysis.
- Look beyond the numbers: While the financial statement provides a lot of information, it is essential to look beyond the numbers. Understand the company’s industry, management, competition and economic environment. This information can help to explain certain financial results and identify future opportunities and risks.
- Get an independent opinion: It’s a good idea to get an independent opinion from an expert, like an accountant or a financial analyst, who can provide additional insights and a different perspective on financial statement analysis.
- Update with new information: It’s important to be aware of any significant news or events that may have an impact on the company’s financial performance and update the analysis accordingly.
To conclude
Financial statement analysis is a useful tool for analysing any company’s performance and fundamental analysis. It helps you in making informed decisions about a company, knowing the current position of a company, eliminating discrepancies, and reducing the chances of fraud. There are many more advantages to financial statement analysis, and so are the limitations. Hence, it is always worthwhile to take the guidance of a financial analyst or advisor and use reliable tools like Tickertape. And to learn more about the financial world, its jargon, and basic guidance, continue reading Blog by Tickertape.
FAQs
What is the meaning of financial statement analysis?
The process of analysing a company’s financial statement thoroughly is known as financial statement analysis. It comprises several aspects such as ratio analysis, trend analysis, cash-flow analysis, competitor analysis, and more.
What are the types of financial statement analysis?
There are various types or methods of financial statement analysis, including horizontal analysis, vertical analysis, ratio analysis, trend analysis, and cost volume profit analysis.
As an insatiable reader and learner, I’ve spent the last two years exploring the world of finance. With my creative mind and curious spirit, I love making complex finance topics easy and fun for everyone to understand. Join me on my journey as we navigate the world of finance together!


