Shree Renuka Sugars Ltd
RENUKAShree Renuka Sugars Ltd
RENUKAPrice Chart

Scorecard
Performance
LowHasn't fared well - amongst the low performers
Valuation
HighSeems to be overvalued vs the market average
Growth
LowLagging behind the market in financials growth
Profitability
AvgAverage profitability - not good, not bad
Entry point
AvgThe stock is not in the overbought zone
Red flags
LowNo red flag found
How to use scorecard? Learn more
Key Metrics
| No LabelNo Label | PB RatioPB Ratio | Dividend YieldDiv. Yield |
|---|---|---|
| -17.04 | -12.14 | — |
| Sector PESector PE | Sector PBSector PB | Sector Div YldSctr Div Yld |
|---|---|---|
| 54.79 | 10.97 | 1.32% |
Forecast & Ratings
Detailed Forecast Price
Price Upside
Earnings
Earnings Growth
Revenue
Rev. Growth
Company Profile
Shree Renuka Sugars Limited is a agri-business and bio-energy company. The Company produces integrated sugar and bio-energy.
Peers
Compare with peersE I D-Parry (India) Ltd
Balrampur Chini Mills Ltd
Triveni Engineering and Industries Ltd
Piccadily Agro Industries Ltd
Bajaj Hindusthan Sugar Ltd
Get more out of Tickertape, Go Pro!
Customise key metrics, see detailed forecasts, download stock data and more
Forecasts
Price
Revenue
Earnings
Price Forecast
Revenue Forecast
Earnings Per Share Forecast
Income
Balance Sheet
Cash Flow
Income Statement
| Financial Year | FY 2016 | FY 2017 | FY 2018 | FY 2019 | FY 2020 | FY 2021 | FY 2022 | FY 2023 | FY 2024 | TTM | ||||||||||
|---|---|---|---|---|---|---|---|---|---|---|---|---|---|---|---|---|---|---|---|---|
| Total Revenue | 9,933.09 | 12,221.66 | 7,815.95 | 4,717.59 | 7,745.09 | 5,947.51 | 6,501.64 | 9,106.54 | 11,367.40 | 11,457.70 | ||||||||||
| Raw Materials | 8,726.11 | 9,796.33 | 6,766.25 | 4,188.59 | 4,113.46 | 4,771.68 | 4,893.50 | 7,164.10 | 10,645.00 | 10,735.30 | ||||||||||
| Power & Fuel Cost | 11.67 | 35.98 | 36.33 | 65.21 | 62.81 | 82.26 | 158.23 | 256.75 | ||||||||||||
| Employee Cost | 204.97 | 194.57 | 120.18 | 126.60 | 120.51 | 125.17 | 141.72 | 166.70 | ||||||||||||
| Selling & Administrative Expenses | 374.58 | 434.86 | 266.32 | 250.88 | 216.23 | 259.99 | 286.68 | 461.02 | ||||||||||||
| Operating & Other expenses | 819.96 | 1,012.74 | 2,713.42 | 1,351.38 | 348.68 | 63.96 | 559.55 | 408.48 | ||||||||||||
| EBITDA | -204.20 | 747.18 | -2,086.55 | -1,265.07 | 2,883.40 | 644.45 | 461.96 | 649.49 | 722.40 | 722.40 | ||||||||||
| Depreciation/Amortization | 775.58 | 954.96 | 240.09 | 220.71 | 210.77 | 208.51 | 207.91 | 237.65 | 266.20 | 266.20 | ||||||||||
| PBIT | -979.78 | -207.78 | -2,326.64 | -1,485.78 | 2,672.63 | 435.94 | 254.05 | 411.84 | 456.20 | 456.20 | ||||||||||
| Interest & Other Items | 976.42 | 958.11 | 519.26 | 560.44 | 511.25 | 384.18 | 392.62 | 591.40 | 918.00 | 918.00 | ||||||||||
| PBT | -1,956.20 | -1,165.89 | -2,845.90 | -2,046.22 | 2,161.38 | 51.76 | -138.57 | -179.56 | -461.80 | -461.80 | ||||||||||
| Taxes & Other Items | -146.79 | -14.01 | -1,141.96 | -597.85 | 62.21 | 166.52 | -0.03 | 17.40 | 165.40 | 165.30 | ||||||||||
| Net Income | -1,809.41 | -1,151.88 | -1,703.94 | -1,448.37 | 2,099.17 | -114.76 | -138.54 | -196.96 | -627.20 | -627.10 | ||||||||||
| EPS | -19.48 | -12.29 | -11.91 | -7.56 | 10.95 | -0.57 | -0.65 | -0.93 | -2.95 | -2.95 | ||||||||||
| DPS | 0.00 | 0.00 | 0.00 | 0.00 | 0.00 | 0.00 | 0.00 | 0.00 | 0.00 | 0.00 | ||||||||||
| Payout ratio | 0.00 | 0.00 | 0.00 | 0.00 | 0.00 | 0.00 | 0.00 | 0.00 | 0.00 | 0.00 |
Company Updates
Peers & Comparison
Consumer StaplesSugar
Valuation
Technical
Forecast
 Compare valuation on Screener
| Stock | PE RatioPE Ratio | PB RatioPB Ratio | Div. YieldDividend Yield |
|---|---|---|---|
| Shree Renuka Sugars Ltd | -17.04 | -12.14 | — |
| E I D-Parry (India) Ltd | 15.13 | 1.21 | 0.52% |
| Balrampur Chini Mills Ltd | 16.88 | 2.65 | 0.67% |
| Triveni Engineering and Industries Ltd | 22.46 | 3.33 | 1.42% |
Price Comparison
Compare RENUKA with any stock or ETFShareholdings
Promoter Holdings Trend
Total Promoter Holding
In last 6 months, promoter holding in the company has almost stayed constant
Low Pledged Promoter Holding
Pledged promoter holdings is insignificant
Institutional Holdings Trend
Total Retail Holding
In last 3 months, retail holding in the company has almost stayed constant
Foreign Institutional Holding
In last 3 months, foreign institutional holding of the company has almost stayed constant

Shareholding Pattern
Sep 2023
Dec 2023
Mar 2024
Jun 2024
Shareholding History
Mutual Funds Holding Trend

Mutual Fund Holding
In last 3 months, mutual fund holding of the company has almost stayed constant
Top 5 Mutual Funds holding Shree Renuka Sugars Ltd
| Funds (Top 5) | The rupee value of the stock held by the fund divided by the stock’s market cap Market-cap held | Percentage of the fund’s portfolio invested in the stock Weight | Change in the portfolio weight of the stock over the last 3 months 3M holding change | The rank of the stock in the fund’s portfolio based on its weight in the portfolio along with the change in the rank over the last 3 months Portfolio rank(3M change) |
|---|---|---|---|---|
Nippon India Nifty Smallcap 250 Index Fund - Growth - Direct Plan Growth | The rupee value of the stock held by the fund divided by the stock’s market cap 0.0271% | Percentage of the fund’s portfolio invested in the stock 0.22% | Change in the portfolio weight of the stock over the last 3 months 0.00% | The rank of the stock in the fund’s portfolio based on its weight in the portfolio along with the change in the rank over the last 3 months 182/253 (+13) |
SBI Nifty Smallcap 250 Index Fund - Direct Plan - Growth Growth | The rupee value of the stock held by the fund divided by the stock’s market cap 0.0179% | Percentage of the fund’s portfolio invested in the stock 0.22% | Change in the portfolio weight of the stock over the last 3 months 0.00% | The rank of the stock in the fund’s portfolio based on its weight in the portfolio along with the change in the rank over the last 3 months 183/253 (+13) |
Motilal Oswal Nifty Smallcap 250 Index Fund - Growth - Direct Plan Growth | The rupee value of the stock held by the fund divided by the stock’s market cap 0.0141% | Percentage of the fund’s portfolio invested in the stock 0.22% | Change in the portfolio weight of the stock over the last 3 months 0.00% | The rank of the stock in the fund’s portfolio based on its weight in the portfolio along with the change in the rank over the last 3 months 182/254 (+13) |
Compare 3-month MF holding change on Screener
smallcases
Looks like this stock is not in any smallcase yet.
Events
Dividend Trend
No Dividends
RENUKA has not given any dividends in last 5 years
Dividends
Corp. Actions
Announcements
Legal Orders
Upcoming Dividends
No upcoming dividends are available
Past Dividends
Cash Dividend
Ex DateEx DateAug 19, 2013
Dividend/Share
₹0.50
Ex DateEx Date
Aug 19, 2013
Cash Dividend
Ex DateEx DateOct 5, 2011
Dividend/Share
₹1.00
Ex DateEx Date
Oct 5, 2011
Cash Dividend
Ex DateEx DateOct 5, 2010
Dividend/Share
₹1.00
Ex DateEx Date
Oct 5, 2010
Delta Corp Ltd leads gainers in ‘A’ group

KIOCL Ltd leads gainers in ‘A’ group
India’s sugar demand surges in heat wave and election season

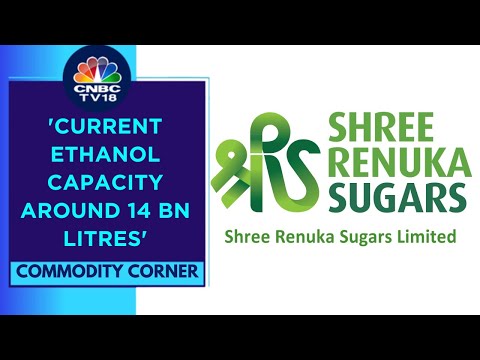

Sugar Sector To Do Well As Ethanol Is A Big Game Changer, Says Shree Renuka Sugars


Shree Renuka Sugars Q4 results: Net profit declines 72% to Rs 42.8 crore

Shree Renuka Sugars Q4 net profit declines 72.61% to Rs 42.8 crore


Higher than Industry Revenue Growth
Over the last 5 years, revenue has grown at a yearly rate of 19.23%, vs industry avg of 9.1%
Increasing Market Share
Over the last 5 years, market share increased from 8.28% to 12.71%