


Evaluating stocks
All the ratios & metrics you need
ROCE
Return on capital employed (ROCE) is a financial ratio that measures a company’s profitability and the efficiency with which it uses capital. Return on capital employed is calculated by dividing net operating profit, or earnings before interest and taxes (EBIT), by employed capital (ie total assets minus total current liabilities for the most recent financial year). A good ROCE signals that the company is healthy and its resources are properly managed.
1Y Max Loss
Indicates the maximum fall in the value of the investment over the previous 1 year; In simple terms, it is the % return an investor would have made if they would have bought a stock at the highest price point and sold and the lowest price point in the past year. It gives investors an idea of the worst-case return if they decide to invest in a particular stock. Also known as maximum drawdown, the calculation of this metric is not as straightforward as the % difference between the 52 week high and low. Since the low could be before the high, that might not necessarily be your worst return, rather the % difference between 52 week high and the lowest point occurring after it would be your max loss.
Simple Moving Average
A simple moving average (SMA) is just what it sounds like, simply an average of the closing prices in a particular date range. For instance, a 10D SMA means the average of all closing prices from today to 10 days ago. It is primarily a technical indicator more relevant for traders. Comparing average closing prices of different stocks doesn’t tell much, since the absolute stock price can be anything, and irrelevant to how good the company is at its core. However, since closing prices change daily, it can cause unnecessary noise in price-specific ratios like P/E, P/S, etc. To avoid this, users can implement smoothened out ratios like (50D SMA)/E rather than just P/E as custom filters.
We have added 10, 50, 100, and 200 day SMAs as screener filters
Exponential Moving Average
An exponential moving average (EMA) is a type of moving average (MA) that places a greater weight and significance on the most recent data points. The exponential moving average is also referred to as the exponentially weighted moving average. An exponentially weighted moving average reacts more significantly to recent price changes than a simple moving average (SMA), which applies an equal weight to all observations in the period.
The following formula is used to calculate the current EMA:
EMA = Closing price x multiplier + EMA (previous day) x (1-multiplier)
The multiplier is added for smoothing (weighting) the EMA, which typically follows the formula: [2 ÷ (number of observations + 1)]. For a 20-day moving average, the multiplier would be [2/(20+1)]= 0.0952.
We have added 10, 50, 100, and 200 day EMAs as screener filters
Cost of Goods Sold
Cost of Goods Sold refers to the direct cost of producing goods sold by the company. This usually includes raw material and labour costs expended to produce the good. An important point to note is that COGS is mostly relevant for inventory heavy businesses. For example, NBFCs like Bajaj Finance don’t have relevant COGS values.
Cash Flow Margin
Cash Flow Margin is the Cash from operations divided by total revenue for the most recent financial year.
Operating cash flow margin measures how efficiently a company converts sales into cash. It is a good indicator of earnings quality because it only includes transactions that involve the actual transfer of money. This ratio uses operating cash flow, which adds back non-cash expenses.
5Y Avg Cash Flow Margin
5Y Avg Cash Flow Margin is the Average of annual cash flow margin for the 5 most recent financial years
5Y CAGR
Compound annual growth rate (CAGR) is the rate of return that would be required for an investment to grow from its beginning balance to its ending balance, assuming the profits were reinvested at the end of each year of the investment’s lifespan. The CAGR isn’t a true return rate, but rather a representational figure. It is essentially a number that describes the rate at which an investment would have grown if it had grown the same rate every year and the profits were reinvested at the end of each year. In reality, this sort of performance is unlikely. However, CAGR can be used to smooth returns so that they may be more easily understood when compared to alternative investments. For example, if a stock’s 5Y CAGR is 20%, it implies if one had invested 100 Rs in the stock 5 years back and never withdrawn any amount of gains or losses, they would have made 100*(1 + 20/100)^5 = 248.832
Face value
Face value is a financial term used to describe the nominal value of a security, as stated by its issuer. For stocks, the face value is the original cost of the stock, as listed on the certificate.
The cumulative face value of the entirety of a company’s stock shares designates the legal capital a corporation is obligated to maintain. Only the above-and-beyond capital may be released to investors, in the form of dividends. In essence, the funds that cover the face value, function as a type of default reserve.
The face value of a stock does not denote the actual market value, which is determined based on principles of supply and demand, often governed by the figure at which investors are willing to buy and sell a particular security, at a specific point in time. In fact, depending on market conditions, the face value and market value usually have no correlation.
No. of Shareholders
This is the number of unique DEMAT accounts that hold at least one share of a particular stock. This can be an indicator of the breadth of a company’s investor base. Its value might not be very helpful in comparison standalone but can have interesting use cases in custom filters.
Retail Investor Holding
A retail investor is an individual who purchases securities for his or her own personal account rather than for an organization.
Retail investors typically trade in much smaller amounts compared to institutional investors such as mutual funds, pensions, or university endowments.
This filter tells what percentage of a company’s outstanding shares are held by retail investors.
Insurance Firms Holding
Percentage of company’s common stock held by insurance firms. Insurance companies invest in many areas, but most of all they invest in bonds. This makes sense because bonds are perhaps the safest of all investment categories. Hence, an Insurance firm’s holding in a particular stock may suggest a lower risk profile for that stock as well.
Bulk Deals – Cumulative
These data items tell us the cumulative number of shares traded under bulk deals over a given time period as a % of total shares outstanding. We’ve added Bulk Trades – 1M, 3M, 6M cumulative as screener filters. For example, Bulk Deals – 3M Cumulative is calculated by summing up the number of shares traded in all the Bulk deals that have occurred in the past 3 months, then dividing it by the total number of shares outstanding and finally multiplying it by 100 to arrive at a percentage value
A bulk deal is a deal where the total quantity of shares bought or sold is greater than 0.5% of the share capital of the company. A bulk deal is transacted through the normal trading window and SEBI mandates the broker to report these high-value transactions. This can be looked at as a signal of building interest in a particular stock. Normally, bulk deals tend to be indicative of a sudden spurt in interest from informed investors. These basically give an indication of what stocks, big institutions, and asset management firms are buying.
Insider Trades – Cumulative
These data items tell us the cumulative number of shares traded by insiders of the company over a given time period as a % of total shares outstanding. We’ve added Insider Trades – 1M, 3M, 6M cumulative as screener filters. For example, Insider Trades – 3M Cumulative is calculated by summing up the number of shares traded in all the insider trades that have occurred in the past 3 months, then dividing it by the total number of shares outstanding and finally multiplying it by 100 to arrive at a percentage value
An insider is someone with either access to valuable non-public information about a corporation or ownership of stock equaling more than 10% of a firm’s equity. The kind of information found in filings is extremely valuable to individual investors. For example, if insiders are buying shares in their own companies, they might know something that normal investors do not. The insider might buy because they see great potential, the possibility for merger or acquisition in the future, or simply because they think their stock is undervalued. While the data are important, just remember that large companies might have hundreds of insiders, which means that trying to determine a pattern can be difficult.
Working Capital Turnover Ratio
Working Capital Turnover Ratio is the Total revenue of a company divided by average working capital over the past 2 financial years. It measures how efficiently a company is using its working capital to support sales and growth. Also known as net sales to working capital, working capital turnover measures the relationship between the funds used to finance a company’s operations and the revenues a company generates to continue operations and turn a profit.
A higher working capital turnover ratio is better and indicates that a company is able to generate a larger amount of sales. However, if working capital turnover rises too high, it could suggest that a company needs to raise additional capital to support future growth.
Net Income / Liabilities
Net income divided by total liabilities for the most recent financial year. It is a measure to see if a company has enough cash flow to pay off long-term debts while also meeting other short-term obligations. Also, know as the solvency ratio, it can determine if a company’s finances are healthy enough to pay off long-term debts and still operate.
Days Payable Outstanding
Average number of days a company takes to make payments to its trade creditors.
A company with a higher value of DPO takes longer to pay its bills, which means that it can retain available funds for a longer duration, allowing the company an opportunity to utilize those funds in a better way to maximize the benefits. A high DPO, however, may also be a red flag indicating an inability to pay its bills on time.
Days of Sales Outstanding
Days of Sales Outstanding is the average number of days a company takes to collect payment of a sale.
A high DSO number suggests that a company is experiencing delays in receiving payments. That can cause a cash flow problem. A low DSO indicates that the company is getting its payments quickly. That money can be put back into the business to good effect.
It is important to note that DSO can vary from business to business. In the financial industry, relatively long payment terms are common. In the agriculture and fuel industries, fast payment can be crucial. In general, small businesses rely more heavily on steady cash flow than large, diversified companies.
Days of Inventory Outstanding
Days of Inventory Outstanding is the average number of days a company holds inventory before turning it into sales.
Indicating the liquidity of the inventory, the figure represents how many days a company’s current stock of inventory will last. Generally, a lower DIO is preferred as it indicates a shorter duration to clear off the inventory, though the average DSI varies from one industry to another.
DIO is a metric that analysts use to determine the efficiency of sales. A smaller number indicates that a company is more efficiently and frequently selling off its inventory, which means rapid turnover leading to the potential for higher profits (assuming that sales are being made in profit). However, this number should be looked upon cautiously as it often lacks context. DIO tends to vary greatly among industries depending on various factors like product type and business model. Therefore, it is important to compare the value among the same sector peer companies. Companies in the technology, automobile, and furniture sectors can afford to hold on to their inventories for long, but those in the business of perishable or fast-moving consumer goods (FMCG) cannot. Therefore, sector-specific comparisons should be made for DIO values.
Asset Turnover Ratio
Asset Turnover Ratio is calculated as the total revenue of a company divided by average total assets over the past 2 financial years.
The asset turnover ratio measures the value of a company’s sales or revenues relative to the value of its assets.
This metric helps investors understand how effectively companies are using their assets to generate sales. The higher the asset turnover ratio, the more efficient a company is at generating revenue from its assets. Conversely, if a company has a low asset turnover ratio, it indicates it is not efficiently using its assets to generate sales.
Inventory Turnover Ratio
The inventory turnover ratio is calculated as the Cost of goods sold of a company divided by average inventory over the past 2 financial years. Inventory turnover measures how many times in a given period a company is able to replace the inventories that it has sold.
A slow turnover implies weak sales and possibly excess inventory, while a faster ratio implies either strong sales or insufficient inventory. High volume, low margin industries such as retailers and supermarkets tend to have the highest inventory turnover.
Earning Power
Earning power is a company’s ability to generate profit. Specifically, its ability to generate profit from its operations. Investors and analysts calculate earning power to determine whether a company is worth investing in.
It is calculated by dividing EBIT with total assets for the most recent financial year. (EBIT can be calculated as revenue minus expenses excluding tax and interest. EBIT is also referred to as operating earnings, operating profit, and profit before interest and taxes.)
Number of analysts with buy recommendations
It is the number of analysts suggesting to buy a particular stock out of the total analysts who have researched the stock.
It gives a general idea on a stock’s performance as well as future value. We have other similar filters like: % of analysts giving buy and sell recommendations but this absolute value additionally gives an idea of how many analysts are covering the stock
Book Value
In theory, Book Value is the sum that shareholders would receive in the event that the firm was liquidated, all of the tangible assets were sold and all of the liabilities were paid.
Book value can be used by investors to gauge whether a stock price is undervalued by comparing it to the firm’s market capitalisation. If a company’s book value is higher than its market cap, then the stock can be considered undervalued and if it’s lesser, the company can be considered overvalued. However, this basic check usually holds true for inventory/asset-intensive businesses. Book Value of IT services companies for instance is mostly on the lower side, because they generate capital out of human resources rather than physical assets, but that doesn’t imply every IT company is forever undervalued.
Dividend Yield vs Sub-sector
It is the percentage difference between the dividend yield of a company and the average dividend paid by all companies within that sub-sector
PS Premium vs Sub-sector
Stock PS ratio divided by the corresponding sub-sector PS ratio minus one. Similar use cases to PE and PB premiums vs sub-sector
PB Premium vs Sub-sector
Similar to Premium vs Sector, we have PB Premium vs Sub-sector as well. It is basically the stock PB ratio divided by the corresponding sub-sector PB ratio minus one. The interpretation is also similar to the premiums vs sector, but sometimes a sector is a very broad universe to compare. For instance, You can’t compare a 2 wheeler company’s PB with an Airline’s PB, but both are in the same sector. Hence, for users looking to find stock-specific investing opportunities in niche industries, this metric might be more helpful. However since stocks in a sub-sector are obviously less than a sector, this metric is susceptible to bias, where one or two companies could grossly affect the sub-sector’s average, but affecting the sector’s average might be tough since there are many more companies and more business varieties which won’t necessarily have correlated earning cycles
PE Premium vs Sub-sector
Similar to Premium vs Sector, we have PE Premium vs Sub-sector as well. It is basically the stock PE ratio divided by the corresponding sub-sector PE ratio minus one. The interpretation is also similar to the premiums vs sector, but sometimes a sector is a very broad universe to compare. For instance, You can’t compare a bank’s PE with an NBFC’s PE, but both are financials. You can’t compare agriculture machinery with a stationary company but both are in the industrial sector. Hence, for users looking to find stock-specific investing opportunities in niche industries, this metric might be more helpful. However since stocks in a sub-sector are obviously less than a sector, this metric is susceptible to bias, where one or two companies could grossly affect the sub-sector’s average, but affecting the sector’s average might be tough since there are many more companies and more business varieties which won’t necessarily have correlated earning cycles
Price / CFO
Price / CFO is the Market capitalisation of the company divided by cashflow from operations for the most recent financial year. It is a stock valuation indicator or multiple that measures the value of a stock’s price relative to its operating cash flow per share. It’s different from price / free cash flow since it gives an indication of how cash-rich is the company’s core business. This ratio could be misleading if analysed standalone. It’s best to analyse it with other cash-based valuation metrics. For instance, a low Price / CFO but a high Price / FCF might indicate the company’s core business is functioning well but the company is aggressively reinvesting its profits
EV / Free Cash Flow
EV / Free Cash Flow compares the total valuation of the company with it’s ability to generate free cash flow.
Enterprise Value to Free Cash Flow compares the total valuation of the company with its ability to generate cashflow. The lower the ratio of enterprise value to the free cash flow figures, the faster a company can pay back the cost of its acquisition or generate cash to reinvest in its business.
EV / Invested Capital
EV / Invested Capital is Enterprise Value divided by invested capital of the last financial year.
It measures the Enterprise Value against capital invested by shareholders and lenders. The invested capital is especially useful when capital assets are a key driver of revenue and earnings. Stocks trading at high multiples of invested capital may also be more susceptible to competition, since investing in similar assets will be attractive to investors.
EV / Revenue Ratio
Current Enterprise Value divided by the total revenue at the end of the most recent financial year.
It is one of several fundamental indicators that investors use to determine whether a stock is priced fairly. The EV/Revenue ratio is also often used to determine a company’s valuation in the case of a potential acquisition. The lower the better, in that, a lower EV/R multiple signals a company is undervalued.
EV / EBIT Ratio
Current Enterprise Value divided by the EBIT at the end of the most recent financial year.
This metric is used as a valuation tool to compare the value of a company (debt included), to the company’s cash earnings less non-cash expenses. It’s ideal for analysts and investors looking to compare companies within the same industry.
Enterprise Value
Enterprise Value is the sum of a company’s latest market cap, total debt, and minority interest less cash short term investment at the end of the most recent financial year. Enterprise value (EV) is a measure of a company’s total value, often used as a more comprehensive alternative to equity market capitalization.
Enterprise value (EV) could be thought of like the theoretical takeover price if a company were to be bought. EV differs significantly from simple market capitalization in several ways, and many consider it to be a more accurate representation of a firm’s value. The value of a firm’s debt, for example, would need to be paid off by the buyer when taking over a company. As a result, enterprise value provides a much more accurate takeover valuation because it includes debt in its value calculation. It is used as the basis for many financial ratios that measure the performance of a company.
Price / Free Cash Flow
Price / Free Cash Flow is the Market capitalization of the company divided by free cash flow for the most recent financial year. It is an equity valuation metric that indicates a company’s ability to generate additional revenues. A lower value for price to free cash flow could indicate that the company is cash-rich but the market isn’t betting on its ability to use this cash for further growth. A higher ratio might suggest that the company is valued by the market based on intangibles like brand recall, future prospects but the company isn’t generating a lot of cash
Insider Trades
Insider trading is a term subject to many definitions and connotations and it encompasses both legal and prohibited activity.
Insider trading is the buying, selling, or dealing in securities of a listed company by a director, member of management, employee of the company, or by any other person such as internal auditor, advisor, consultant, analyst, etc, who have knowledge of material inside information which is not available to the general public.
Insider trading takes place legally every day, when corporate insiders – officers, directors, or employees – buy or sell stock in their own companies within the confines of company policy and the regulations governing this trading. Hence Insider trading can be legal as long as it conforms to the rules set forth by SEBI
Legal examples of Insider Trading
CEO or a board member of company ABC buys 2,000 shares of stock in the company ABC. The trade is reported to the SEBI.
An employee of a company exercises his stock options and buys 500 shares of stock in the company that he works for.
Illegal examples of Insider Trading
A member of the leadership team of a company overhears a meeting where the CFO is talking about how the company is going to be driven into bankruptcy as a result of severe financial problems. The employee knows that his friend owns shares of the company. The employee warns his friend that he needs to sell his shares right away.
A government employee is aware that a new regulation is going to be passed that will significantly benefit an electricity company. The government employee secretly buys shares of the electricity company and then pushes for the regulation to go through as quickly as possible
Latest Regulations in India
On 18th January 2019, the Securities and Exchange Board of India (SEBI) decided to hold promoters of the company, irrespective of their shareholding status, responsible for violation of insider trading norms if they possess non-published price-sensitive information (UPSI) regarding the company without any a legitimate purpose.
SEBI specified “that the term legitimate purpose will include sharing of the non-published price-sensitive information (UPSI) in the ordinary course of business by an insider with partners, collaborators, lenders, customers, suppliers, merchant bankers, legal advisors, auditors, insolvency professionals or other advisors or consultants, provided that such sharing has not been carried out to evade or circumvent the prohibitions of these regulations.”
This amendment is introduced under “Prohibition of Insider Trading”.
Read more information on Insider Trade regulations
Bulk & Block Deals
These are large transactions made by promoters, mutual funds, financial institutions, insurance companies, banks, venture capitalists, and foreign institutional investors that have the power to control the movement of stock prices.
Bulk and block deals done on exchanges are keenly watched by market participants daily as they indicate the interest of big investors in the stock. Though these two terms sound similar, there is a difference between them. Here’s what they mean and how investors should interpret them
Block deals
Block deal is a trade, with a minimum quantity of 5 lakh shares or minimum value of Rs. 5 crores, executed through a single transaction, on the special “Block Deal window”. The window is opened for only 35 minutes in the morning trading hours. A Block deal happens when two parties agree to buy or sell securities at an agreed price between themselves and inform the stock exchange. The orders in a block deal are not shown to the people who trade from the normal trade window.
Market regulator SEBI (Securities and Exchange Broad of India) has also made it mandatory for the stockbrokers to disclose on a daily basis.
Stock exchanges should disclose the information on block deals to the public on the same day after market hours. This should contain information bits like the name of the scrip, name of the client, the number of shares, traded price, etc
Bulk deals
A bulk deal is a trade, where the total quantity bought or sold is more than 0.5% of the number of equity shares of a listed company.
Bulk deal can be transacted by the normal trading window provided by brokers throughout the trading hours in a day. Bulk deals are market-driven and take place throughout the trading day.
The stockbroker, who facilitates the trade, is required to reveal to the stock exchange about the bulk deals on a daily basis.
Bulk orders are visible to everyone. If the bulk deal happens through a single trade, it should be notified to the exchange immediately upon the execution of the order. If it happens through multiple trades, it should be notified to the exchange within one hour from the closure of the trading
Regulatory requirements
To facilitate block deals, stock exchanges provide a separate trading window for only 35 minutes at the beginning of the trading hours.
The transaction price of a share ranges from +1% to -1% of the previous days closing or the current market price. These transactions take place on a delivery basis.
Transparent disclosure of trade transaction details such as the name of scrip, name of the clients (Buyer and Seller), the number of shares bought/sold, and traded price have to be made by the broker to the exchange immediately. The exchange has to furnish all the transaction-related information to the public markets on the same day as the block deal transaction, after the closing of trading hours
Custom Filters
While the Screener comes with a host of in-built filters that you can use to shortlist stocks, it also gives you the ability to create your own filter. The Custom Filter feature is available to all users.
A custom filter is a stock filter that has been created by a user. Such a filter can be created by using two to five data items on Screener. Custom filters are useful because they allow you to dig deeper into the stock universe and search for companies that match your specific criteria.
While the default filters are more than useful for most users to filter stocks, savvier users can create custom filters to be able to carry out deeper research.
Let’s understand this with the example of Quick Ratio, which is a custom filter that you can create on Screener. Quick ratio is an extension of the existing filter–Current Ratio.
Current ratio is a measure of a company’s ability to pay off its debts.
Current ratio is calculated as current assets divided by current liabilities. If the current liabilities of a company are lower than its current assets, it means that the company has sufficient assets (cash in bank, receivables, etc) to pay off liabilities like interest on loans as and when required. Hence, the higher the current ratio, the better a company is equipped to repay liabilities on time. A higher current ratio depicts good financial health of the company.
While current ratio tells us how likely a company is to pay off its debts in the near term, it doesn’t take into account an important factor, which is the company’s inventories. This is where Quick Ratio comes into the picture.
Quick ratio = (current assets – inventories) / current liabilities
Here, inventories are important because it is difficult to sell then quickly and use the cash to pay off a company’s debt. A company’s ‘quick assets’, which are assets that can be used immediately are a more accurate gauge of how likely a company is to pay off the debt. Inventories are assets, but cannot be used in the near future. Hence, quick ratio goes one step ahead of current ratio and removes inventories from the equation.
Quick ratio is one custom filter that can be created on the Tickertape Screener by using three data items–current assets, current inventories and current liabilities. There are many other data items that can be used to create other custom filters.
Creating a custom filter
To create a custom filter, you have to click on the ‘Add Filter’ button and then go to the ‘Custom’ option on the top.
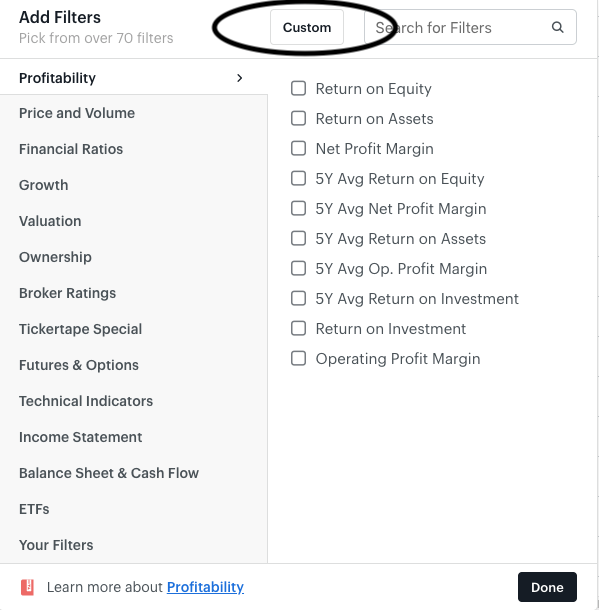
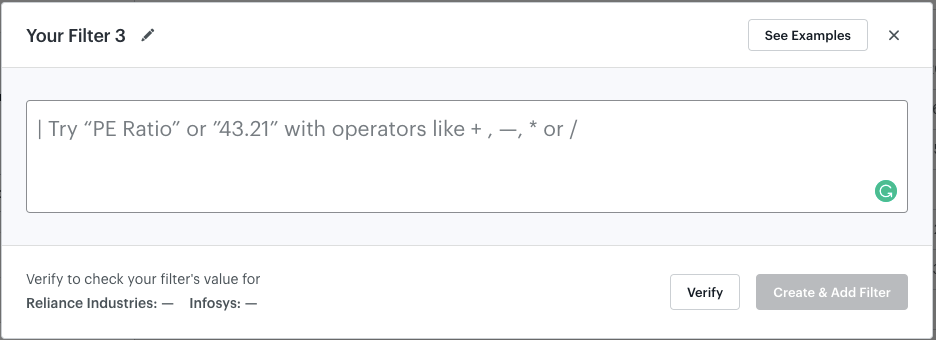
You can then type in the data items you need in your filter and create it. You can give the filter a name of your choice and verify it as well.
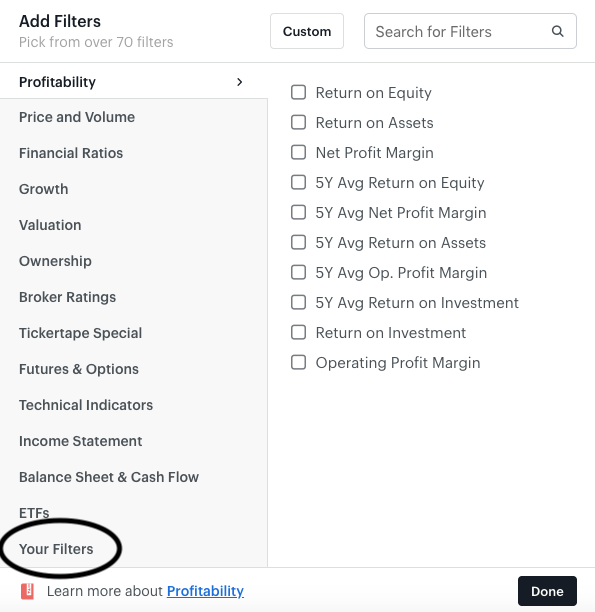
All of your custom filters appear under the ‘Your Filters’ tab.
This is how you can create and use custom filters on the Tickertape screener to build a portfolio of stocks that fit your needs and ideas.
Mutual Fund Holding
This data item is calculated as the sum of shares held by the entire universe of equity mutual funds divided by the total shares outstanding of the company. Examples of equity mutual funds are Reliance Small Cap fund which is from the Reliance AMC; HDFC Equity fund, which is from the HDFC AMC, etc.
Mutual funds have superior research capabilities and perform extensive analysis about the company before investing in it. A high mutual fund stake in a company is considered to be an endorsement about the company’s prospect.
Mutual Fund Holding Change – 3M
This data item is calculated as the difference between the current mutual fund ownership percentage and the percentage 3 months ago. Suppose, mutual funds held 40% stake in the company 3 months ago and currently they hold only 34%, the ownership change percentage is (34 – 40) = -6%.
Mutual funds have superior research capabilities and perform extensive analysis about the company before investing in it. A high MF stake in a company is considered to be an endorsement about the company’s prospect. A drastic increase or decrease in MF ownership percentage is a signal of potential change in fortunes of the company.
Mutual Fund Holding Change – 6M
This data item is calculated as the difference between the current mutual fund ownership percentage and the percentage 6 months ago. Suppose, mutual funds held 42% stake in the company 6 months ago and currently they hold only 34%, the ownership change percentage is (34 – 42) = -8%.
Extreme spike or fall in MF ownership level is an indicator of potential change in performance of the company. If MFs anticipate that the company might register improved performance in the future they are likely to increase their stake in the company and vice versa.
Promoter Holding
This data item is calculated as shares held by promoters divided by total shares outstanding of the company. Promoters are individuals or corporations who invest for the purpose of gaining and holding onto stake in the company for very long periods of time. They are interested in running the company and may even hold board positions.
A very high or very low promoter ownership percentage is not desirable. A very high promoter stake will automatically lead to lesser holdings by institutional and retail investors. In such a situation, promoters might take decisions that is adversarial to retail shareholders interest. A very low promoter stake means promoters are not sufficiently invested in the company and might not be interested in running the company.
Promoter Holding Change – 3M
This data item is calculated as the difference between the current promoter ownership percentage and the percentage 3 months ago. Analysing promoter ownership change is tricky as a lot of factors have to be considered before deciding on whether the change is positive or negative for the company.
- If the promoter is selling off stake when the company is reporting poor fundamentals, it means that the entity has lost hope in the future of the company
- A promoter entity increasing stake in the company when share prices are falling either due to weak market conditions or poor fundamentals usually signifies that the long-term potential of the company is strong and that share price fall is a temporary phenomenon
- A marginal stake dilution to bring in other promoter partners is usually seen as positive endorsement of the company. For example, real estate company DLF recently sold 40% stake in a subsidiary company to GIC of Singapore. Markets reacted positively to the news
- A marginal stake dilution when promoter entity has very high holding is considered positive, as the number of shares freely available to buy and sell increases
- If the promoter entity increases stake in the company via market purchase route or preferential allotment at market price or above market price, it is considered positive for the stock
Promoter Holding Change – 6M
This data item is calculated as the difference between the current promoter ownership percentage and the percentage 6 months ago.
Pledged Promoter Holding
Pledging refers to the act of taking loans against the shares one holds. Sometimes, promoters of companies will raise funds, either for personal or professional use, by taking loans using shares of the company that they own as collateral.
Typically, the bank or NBFC lending money will lend an amount that is less than market value of the shares. For example, suppose X is the promoter of Aarti Industries. The total shares outstanding of the company is 10,000 and X holds 60% stake in the company i.e 6,000 shares. If the current market price of each share of Aarti Industries is Rs 20, then X’s total holding is worth Rs.1,20,000 (6000 * 20). X needs Rs.50,000 for his personal use and is planning to pledge some of the shares of Aarti Industries in order to raise the money. Suppose the bank lends Rs.80 for every Rs.100 collateral pledged, X will have to then pledge Rs.62,500 worth of shares to raise Rs.50,000. This translates to 3125 shares (62,500 / 20). So, out of the total shares outstanding 31.25% is pledged (3,125 / 10,000). The difference between the amount of collateral and the amount of money received as loan is the margin amount.
Now, if the share price of the company starts falling, the margin starts getting eroded and the lender can then ask X to either return some part of the loan or pledge more shares in order to make up for the margin shortfall. If X is not able to do so, the lender will then sell the shares in the stock market to raise the required amount and maintain the margin.
In case of volatile markets, holding shares of companies with high pledged percentage is very risky. This is because, if the stock price falls sharply, lenders will sell the shares and this sudden increase in supply of the shares will further push down the price of the stock and investors might incur significant loss.
Domestic Institutional Investor (DII) Holding
This data item is calculated as shares held by institutional investors based in India divided by the total shares outstanding of the company. DII refers to large financial institutions like mutual funds, pension funds, insurance companies, endowment funds etc, which are based in India. Examples of DIIs are Life Insurance Corporation of India and HDFC Mutual Fund.
DIIs conduct extensive research about the prospects of the company & related sector, perform due diligence about capabilities of the management & corporate governance as well as other related factors before investing in a company. Generally, once DIIs decide to invest in a company, they hold onto the shares of the company for a long period of time. A high DII stake in a company is considered to be an endorsement about the company’s prospects.
DII Holding Change – 3M
This data item is calculated as the difference between the current DII ownership percentage and the percentage 3 months ago. Suppose, DIIs held 14% stake in the company 3 months ago and currently they hold 18.5%, the ownership change percentage is (18.5 – 14) = 4.5%.
A drastic increase or decrease in DII ownership percentage is a signal of a potential change in the fortunes of the company.
DII Holding Change – 6M
This data item is calculated as the difference between the current DII ownership percentage and the percentage 6 months ago. Suppose, DIIs held 20% stake in the company 6 months ago and currently they hold 18.5%, the ownership change percentage is (18.5 – 20) = -1.5%.
An extravagant change in DII ownership percentage is a signal of potential change in the fortunes of the company. A drastic increase indicates possible improvement in performance of the company and vice versa.
Foreign Institutional Investor (FII) Holding
This data item is calculated as shares held by institutional investors based outside of India divided by the total shares outstanding of the company.
Foreign institutional investments are investments by foreigners in Indian securities including shares, government bonds, corporate bonds, convertible securities, infrastructure securities etc. The class of investors who make investment in these securities are known as Foreign Institutional Investors (FII). According to SEBI regulations, any equity investment by foreigners that is less than or equal to 10% of the capital of a company is called portfolio investment.
Investments by Non-resident Indians is not considered as FII investment.
A high FII stake in a company, especially by sovereign wealth funds, endowment funds etc, is considered to be an endorsement about the company’s prospects. These entities conduct extensive research about the prospects of the company and related sector before investing in the company for the long-term.
FII Holding Change – 3M
This data item is calculated as the difference between the current FII ownership percentage and the percentage 3 months ago. Suppose, FIIs held 10% stake in the company 3 months ago and currently they hold 12.5%, the ownership change percentage is (12.5 – 10) = 2.5%.
If FIIs anticipate that a company will perform well over the long-term and can be relied upon to create shareholder value, they will increase their stake in the company. Else, if the company is expected to underperform, FIIs might sell out, thereby reducing their stake.
FII Holding Change – 6M
This data item is calculated as the difference between the current FII ownership percentage and the percentage 6 months ago. Suppose, FIIs held 7% stake in the company 6 months ago and currently they hold 12.5%, the ownership change percentage is (12.5 – 7) = 5.5%.
A drastic increase or decrease in FII ownership percentage is a signal of potential change in the fortunes of the company.
Balance Sheet
A balance sheet lists the assets, liabilities and capital structure of a company as of a specific date, usually the last day of the financial period. Here, this date will be 31st March 2018. It helps understand what the company owns, what it owes and the amount of money invested by shareholders and debt holders.
Cash and Short-term Investments
Cash & short-term investments is the sum of cash available with the company and amount invested by the company in short-term investment options. Short-term investment options include investments made in liquid securities that usually have a maturity of less than 1 year and can be easily converted into cash. Excess cash amount, which is not required for daily business operations, is usually invested in liquid securities.
In case of banks, the data item also includes cash that has been lent to other banks on a short-term basis.
Cash & short-term investments is on the assets side of the balance sheet in the current assets section.
Total Receivables
Total receivables is the total amount of money that is owed to the business by its customers. Most business sell their goods/services to customers on a credit basis. The customer will be required to pay the due amount to the business within a specific period of time. Between the date of sales and the date on which the customer pays for the goods or services, the due amount is recorded under the total receivables head.
The data item is relevant only in case of industrial, utility and insurance companies.
Total receivables is marked on the assets side of the balance sheet under the current assets section.
Total Inventory
Inventory is the sum of finished goods waiting to be sold, work-in-progress items and raw materials that will be used to manufacture finished goods.
This data item is relevant only in case of industrial and utility companies.
Total inventory is marked on the assets side of the balance sheet under the current assets section.
Other Current Assets
Other current assets in case of industrial & utility companies refers to the sum of all the other current assets apart from cash & short-term investments, total receivables and total inventory. This might include items like overpaid taxes or taxes paid in advance, current assets of discontinued business, assets being held for sale, etc.
In case of insurance companies, this data item includes prepaid expenses. Prepaid expense refers to the future expense for which the company has already paid money. For example, if the company has paid in advance for 1 years’ supply of printer cartridge, the expense will be recorded as prepaid expense.
This data item is not relevant for banks.
Other current assets is marked on the assets side of the balance sheet under the current assets section.
Total Current Assets
Total current assets refers to the sum of all data items like cash and short-term investments, receivables, inventory and other current assets.
Net Loans
This data item is specific to banks and financial institutions. It refers to the total amount of loans lent by the company minus possible default losses.
Let’s say a bank has 10 customers and it has lent Rs.10,000 to each one of them. It estimates that about 2% of the total loan amount might never be returned and makes provisions for the same. So, the total loan amount is Rs.1,00,000 (10,000 * 10). Loan loss provision is Rs 2,000 (2% * 1,00,000). Hence, the net loan amount will be Rs.98,000 (1,00,000 – 2,000).
Net loans is recorded on the assets side of the balance sheet.
Net Property/Plant/Equipment
Property, plant and equipment refers to the total fixed assets held by the business. These assets are vital to the business and cannot be easily converted to cash. The assets are expected to generate economic benefits for the business over a period greater than 1 year.
Let’s say a business owns 2 pizza baking ovens valued at Rs.35,000 each, furniture valued at Rs.25,000, a car valued at Rs.6,00,000, fridge valued at Rs.12,000 and an a/c unit valued at Rs.18,000. The property, plant and equipment value of the business would be Rs.7,25,000 (35,000 * 2 + 25,000 + 6,00,000 + 12,000 + 18,000).
This data item is recorded on the assets of the balance sheet.
Goodwill and Intangibles
Intangible assets refer to assets that a company derives benefit from, but unlike fixed assets these assets cannot be physically touched or counted. Copyrights, patents and trademarks are all examples of intangible assets. A publishing company has copyright to lots of different books. These books can be printed and sold exclusively by the company due to the copyright, and that is how the business earns revenue. The copyright here is an asset, albeit an intangible one, because it allows the company to generate economic benefit.
Goodwill is a special category of intangible assets. Let’s say a pizza company, Roma, decides to buy out another pizza outlet named “Italiano”. The total assets of Italiano amounts to Rs.10,00,000 and this is the amount that would ideally be paid to the owners of Italiano for buying out their business. However, since Italiano has a loyal customer base and is located in an area that attracts lot of footfalls, the owners demand a premium of Rs.3,00,000 to sell their business. If Roma decides to pay the higher price and purchase the business, the additional Rs.3,00,000 paid will be recorded as goodwill on the assets side of Roma’s balance sheet.
Long Term Investments
Long-term investment refers to the investment made by the company in debt papers, stocks, real estate, etc with the purpose of holding them for more than 1 year. Companies that generate a significant amount of cash may sometimes decide to invest the excess money, which cannot be deployed back into the business, in real estate or debt or equity instruments. If the idea is to stay invested in these assets for more than 1 year, then they are classified as long-term investments.
This data item appears on the assets side of the balance sheet.
Other Assets
Other assets refers to all assets of the company that are not part of current assets, property, plant & equipment, goodwill & intangibles and long-term investments.
Total Assets
This data item indicates the sum of all assets of the company. The sum of total current assets, property, plant & equipment, goodwill & intangibles, long-term investments and other assets should be equal to the amount of total assets.
Accounts Payable
Accounts payable refers to the total amount of money that a company owes its creditors for materials and services sold on credit. The due amount should usually be paid off within a short period of time and is different from other short- and long-term business debt. The accounts payable head also includes the amount of accrued expenses. Accrued expenses refers to the expenses that the company has incurred but not yet paid.
For example, a pizza company buys pizza dough, cheese and vegetables in bulk from a single vendor. The vendor supplies the required raw materials every week but receives payment for the same only once in 2 months. Suppose the company orders about Rs.15,000 worth of goods every week, then at the end of every alternate month the accounts payable of the company would be Rs.1,20,000 (15,000 * 8).
The utilities bill of the company is Rs.2,000 every month. The company pays the total bill amount of Rs.6,000 at the end of each quarter. So at the end of 1st month, the accrued expense is Rs.2,000 and it is Rs.4,000 at the end of second month.
Total Deposits
This data item is specific to banks and financial institutions. It refers to the sum of all deposits (like savings bank deposits, fixed deposits etc) that have been made with the institution.
Other Current Liabilities
This data item refers to all other current liabilities that are not part of the accounts payable & accrued expenses heading. It includes items like short-term debt, dividends payable, advances received from customers, income taxes payable etc.
Total Current Liabiities
Total current liabilities refers to the sum of accounts payable and other current liabilities. In case of banks and financial institutions the data item also includes total deposits.
Total Long Term Debt
Total long-term debt indicates the debt taken on by the company that is due to be paid after more than a year. The debt might be in the form of borrowings from banks/financial institutions, bonds issued by the company, etc.
If a company has taken up a debt of Rs.12,00,000 from a bank and Rs.1,00,000 is up for repayment within 1 year then the balance Rs.11,00,000 is the long-term debt on the books of the company.
Total Debt
Total debt refers to the sum of short- and long-term debt of the company. Short-term debt is the debt of the company that needs to be repaid within 1 year.
Deferred Income Tax
Deferred income tax refers to the taxes that will have to be paid by the company at the end of the fiscal year but has not yet been paid. A deferred income tax item recognises that the company will in the future pay more tax because of a transaction that took place during the current period.
For example, let’s say a pizza comapny receives an order for 1,000 pizzas at a party that will be held next quarter. The sale price of each pizza is Rs.200 and the cost of revenue per pizza is Rs.75. The person who ordered the pizza pays an advance of Rs.50,000 for 250 pizzas. This is the revenue that the company has already received without providing service. The profit on each pizza is Rs.125 (200 – 75). So the advance profit earned is Rs.31,250 (250 * 125). Suppose the tax rate is 25%, then the company owes the government Rs 7,813 (31,250 * 25%). This is the tax amount that has not yet been paid but will have to be paid once the order is fulfilled and revenue is recognised, and will be recorded as deferred income tax.
Minority Interest
Minority interest refers to the amount of interest of subsidiaries that belongs to shareholders other than the parent company.
A subsidiary is a company that is owned or controlled by the holding company. Let’s say Roma, as a business entity, owns 100% of shares of Italiano. Here, Roma is the holding company and Italiano is the subsidiary company. In this case, the holding company has complete right over the profits as well as assets of Italiano.
If Roma holds 75% of shares of Italiano whereas 25% of the shares are held by the previous owner, Roma will still be the holding company and Italiano the subsidiary. Roma will be entitled to only 75% of the profits and assets of Italiano whereas the rest accrues to the other shareholders. 25% of the value of the company is shown in the balance sheet of Roma as minority interest under liabilities.
Other Liabilities
Other liabilities includes liabilities arising from discontinued operations, underfunded pension benefits, etc.
Total Liabilities
Total liabilities refers to the sum of all liabilities of the company. The sum of total current liabilities, total debt, deferred income tax, minority interest and other liabilities should be equal to the amount of total liabilities.
Common Stock
Common stock is a security that gives the holder of that security ownership of the portion of the company. Holders of common stock have a say in the running of the company and the power to vote on corporate policies and decisions. All the profits of the company accrues to the common stockholders. Common stock of the company is issued at a certain face value like Rs.1, Rs.5 or Rs.10. Total common stock refers to the sum of face value of all shares of common stock issued.
For example, if a company issues 10,000 shares of common stock at a face value of Rs.10, the total common stock will be Rs.1,00,000 (10,000 * 10).
Additional Paid-in Capital
Sometimes, a company issues shares of common stock at a premium to the face value. Though the face value of the common stock is Rs.10, the company might issue the stock at a premium of Rs.5. So the buyer will now have to pay Rs.15 for each share of common stock instead of the earlier Rs.10.
If 10,000 shares have been issued at a price of Rs.15, with the premium being Rs.5. Rs.1,00,000 (10,000 * 10) will be the total common stock and Rs.50,000 (10,000 * 5) will be the additional paid-in capital.
Retained Earnings
When a company earns profits, it can either decide to retain the same and invest it in the business or distribute the profits to the shareholders of the company. This retained profit is called retained earnings. It is the residual earnings from operations that is not distributed to shareholders.
Other Equity
Other equity-related data items that are not part of the above mentioned list are accommodated under the head “Other Equity”.
Total Equity
Total equity is the sum of common stock, additional paid-in capital, retained earnings and other equity.
Total Liabilities & Shareholders Equity
Total liabilities and shareholders equity refers to the sum of total liabilities and total equity.
Total Common Shares Outstanding
Common shares outstanding is the total shares of common stock of the company that have been issued.
Total Preferred Shares Outstanding
Preferred stock refers to a class of stock that ranks higher than common stock. In case the company decides to pay dividends, the preferred shareholders are paid before common stockholders. In case of bankruptcy as well, preferred shareholders are entitled to be paid from the company’s assets before common stockholders get any compensation. However, the downside is that while common stockholders have the right to vote on company policy, preferred stockholders do not get to do the same.
Total preferred shares outstanding refers to the sum of total shares of preferred stock of the company.
Policy Liabilities
This data item is specific to insurance companies and represents the total liabilities related to insurance operations of an insurance company. It includes payables for claims & losses to policyholders, reserves created for policy benefits, payables by the insurance company to reinsurers etc.
Cash Flow Statement
A cash flow statement helps understand the actual amount of money that has entered the bank accounts of the company and the money that went out. It provides information about all the cash inflow that a company received via its ongoing operations, investments received by the company, assets sold as well as cash outflow via asset purchase, dividends paid etc. Just like an income statement, cash flow statement is also calculated for a specific period like quarter or year.
Changes in Working Capital
Working capital refers to the difference between total current assets and total current liabilities. Working capital helps us understand the short-term financial health of the company. If the working capital is positive it indicates that the company has enough short-term assets to pay off its short-term liabilities.
Cumulative effect of change in current asset and current liability over the past year is captured in the data item changes in working capital.
| Components of working capital | Change | Effect on working capital |
|---|---|---|
| Current assets | Increase | Increase |
| Decrease | Decrease | |
| Current liabilities | Increase | Decrease |
| Decrease | Increase |
When current assets of a business are increasing, it is usually because items like accounts receivable, inventory and prepaid expenses are increasing. This means cash is going out of the business as sales are not being made or it is being made on credit. Because of this, change in working capital is positive.
When current liabilities of a business are increasing, it is because accounts payable, accrued expenses etc. is increasing i.e. company has been slowing down the payment of dues and retaining cash. Change in working capital is negative because of this.
Cash Flow from Operating Activities
Cash flow from operating activity refers to the amount of money that a company has earned from its regular business activity such as selling goods/services. It excludes any money brought into the business via borrowings or sale of assets.
Cash flow from operating activity can be calculated by using the following formula:
Profit before interest & taxes + depreciation & amortization expense + gains & losses from financing & investment activities + changes in working capital
Cash flow from operating activities should always be compared with the company’s net income. If the cash flow from operating activities is consistently higher than the net income, then the company’s earnings are of high quality. If that is not the case, then one has to attempt to understand why reported net income is not being converted into cash inflow by the company.
Capital Expenditures
Capital expenditure (capex) refers to the amount of money that the company has spent on purchasing property, plant & equipment that will be utilised in business operations. The assets purchased are expected to generate economic benefit for the business over the long-term. Usually, the amount spent on capex will be high compared to the total amount of fixed assets held by the business.
For example, if a pizza company decides to purchase another pizza baking oven, the amount spent on the same will be considered as capital expenditure. However, money spent on buying a spare part for the oven will be considered as operational expense because of its low significance and associated low cost.
Cash from Investing Activities
Cash from investing activities refers to the cash flow generated by the company via purchase and sale of plant, property & equipment (PP&E) or purchase & sale of subsidiaries or investments in marketable securities. For example, if a company has made any purchase of PP&E, then money moves out the company and proportional amount of assets comes in. On the contrary, if a company has sold an asset then PP&E amount will decrease and cash balance will increase.
A positive cash from investing activities balance indicates that money has flown into the company because of net sales of assets whereas a negative balance indicates that assets have been bought by the company.
Total Cash Dividends Paid
This refers to the actual dividend amount that has been paid to common share and/or preferred shareholders of a company. While a company might declare dividends during a particular quarter or financial year, the actual payment of dividends might not always happen during the same financial period.
This data item only considers the actual cash payment made towards dividends during a specific period. Higher the cash dividends paid, greater the cash outflow from the business and lower the cash from financing activities.
Cash from Financing Activities
Cash from financing activities refers to the amount of money that the company has raised by issuing bonds and stocks or the amount of borrowed money that has been repaid. It helps understand the transactions that have taken place within the capital structure, i.e debt and equity.
Increase/decrease of long-term and short-term borrowings and share repurchase as well as share sale are considered while calculating cash from financing activities.
A positive cash from financing activities balance indicates that money has flown into the company either via sale of common stock or debt instruments, i.e. the company has raised money from the market. A negative balance indicates that the company has either paid dividends or repaid a part of its debt or repurchased shares.
Foreign Exchange Effects
It is possible that a company has subsidiaries in foreign locations and the financial statements of such subsidiaries are reported in the currency of the country in which it is located. If an Indian company owns an outlet in New York through a subsidiary, then the subsidiary will report its numbers in USD whereas the Indian company will report numbers of its Indian operations in INR. If the company has to prepare a consolidated financial statement, then it has to convert the numbers of its New York subsidiary into INR.
So if the consolidated statement is being prepared for the 1st Jan 2018 – 31st March 2018 period, cash flow and income statement items are converted into INR using average INR/USD exchange rate between the before mentioned dates.
However, balance sheet items will have to be converted using spot INR/USD rate as of 31st March 2018. The previous periods consolidated balance sheet will be prepared as of the period ending dates INR/USD rate.
Because of the average rate and the sport rate used for conversion, an imbalance is caused that could either increase or decrease the amount of the data item. This increase or decrease will have nothing to do with the actual cash flow and will be caused due to foreign currency fluctuation. This imbalance caused due to fluctuation will be captured in the data item foreign exchange effects.
Net Change in Cash
This data items indicates the difference in cash balance between the start and end of a financial period. If the financial period runs between 1st Jan 2018 and 31st March 2018, net change in cash considers the cash the business holds on 31st Dec 2017 and 31st March 2018 and states the difference between the two. A positive balance indicates that the cash with the company has increased and vice versa.
Total Revenue
To understand Income Statement, let’s begin with the example of Navya, who has been running 3 pizza outlets, named “Roma”, in different parts of her city since the last 3 months. Her outlets are located in strategic locations and attract a lot of people, leading to high sales. It is now time to file taxes and she has to prepare the income statement, balance sheet and cash flow statement of her business to understand whether she has made profits or losses during the previous financial quarter and to understand what her business owns & owes.
The income statement helps understand a company’s performance over a specific period of time. Let’s assume a time frame between 1st January 2018 and 31st March 2018. An income statement helps us understand how much money the business earned, during that specific 3-month period, by selling the goods/services it produced. It also lists out the expenses that the company incurred during the specific period and finally arrives at the profit loss number.
Let us discuss various items in these financial statements to understand them better.
Total revenue
Revenue is the income that a business earns by selling merchandise or offering specific services. It is also referred to as sales or turnover. Revenue is calculated for a specific period like a quarter or a year. Revenue is calculated after adjusting for discounts and product returns.
Let’s suppose between 1st January 2018 and 31st March 2018, Navya sells 10,000 pizzas and the price of each pizza is Rs.200. Her revenue earned during the quarter would be Rs.20,00,000 (10,000 * 200).
Looking at a company’s revenue is important because companies that are able to increase their sales year after year are desirable.
In case of industrial and utility companies, the total revenue is calculated as revenue from all of a company’s operating activities after deducting any sales adjustments.
In case of insurance companies, the total revenue is the total insurance related premium that the company has earned during the period.
In case of banks, total revenue is the sum of interest and non-interest income earned by the bank. Non-interest income includes fees & commissions, credit card fees, foreign currency gains etc.
Cost of Revenue
Cost of revenue is the cost directly incurred in producing the product sold or services rendered. This amount includes the cost of the materials used in creating the product along with direct labor charges and other costs, like electricity expense, directly incurred in producing the product or service. Only direct costs incurred are considered here. Just like revenue, the corresponding cost of revenue is also calculated for a specific period like a quarter or a year. In fact, all income statement items are calculated for a similar time period.
Let’s suppose the raw material required to make a pizza – dough, cheese, vegetables etc – together cost Rs.50 per pizza. Electricity charge incurred in running the oven is Rs.30 per hour and the employee making the pizza gets paid Rs.20 for every pizza he makes. Assuming 6 pizzas can be made in an hour, the electricity charge incurred in making each pizza is Rs.5 (30/6). The cost of revenue is Rs.75 per pizza (50 + 20 + 5). So during the 1st quarter of 2018, Navya’s total cost of revenue was Rs.7,50,000 (10,000 * 75).
Companies that are able to either maintain or decrease their cost of revenue in relation to their sales are desirable.
In case of industrial companies, the cost of revenue is calculated as total operating expense directly related to the goods and services provided. In case of utility companies, along with direct operating expense, operations & maintenance as well as fuel expense is considered.
In case of insurance companies, cost of revenue includes losses & benefits paid to policyholders, underwriting commissions and reinsurance expense.
In case of banks, cost of revenue is the sum of the total interest expense and non interest expense. Total interest expense is the interest paid on deposits and other borrowings. Non interest expense includes labour costs, foreign currency loss, litigation expense etc.
Gross Profit
Gross profit is the difference between total revenue and cost of revenue. It is the profit a company makes after deducting the cost directly associated with making the good or providing the service.
In the example above, the gross profit would be Rs.12,50,000 (20,00,000 – 7,50,000).
Companies that are able to increase or at least maintain their gross profit in relation to sales are desirable.
Operating Costs
This is the cost incurred in administering & maintaining a business on a day-to-day basis. It is the amount expended by a company just to maintain its existence.
Suppose Navya pays Rs.10,000 every month to the manager of each of the pizza outlets, Rs.2,000 every month as cleaning charges of each outlet, and Rs.5,000 towards other sundry expenses, then the operating expense of her company would come to Rs.41,000 every month (10,000 * 3 + 2000 * 3 + 5000). Hence, the total operating expense during the quarter was Rs.1,23,000 (41,000 * 3).
Just like in case of cost of revenue, companies that are able to either maintain or decrease their operating costs in relation to their sales are better.
In case of industrial and utility companies, operating expense is calculated as the sum of selling & general expenses, research & development costs, unusual expenses like restructuring charge & litigation expenses and any other operating expense resulting due to foreign currency adjustments, etc.
In case of insurance companies, the operating expense is calculated as the sum of selling & general expenses, unusual expenses like restructuring charge & litigation expenses and any other operating expense resulting due to foreign currency adjustments, etc.
In case of banks, loan loss provision is a part of the operating expense head. Loan loss provision refers to the provision created for the possible default on loans given out by the bank.
EBITDA
EBITDA stands for earnings before interest, taxes, depreciation and amortization. EBITDA is a measure of the company’s operating performance. This data item helps understand the profits generated by the company via its operations.
In Navya’s case, EBITDA is calculated as gross profit minus operating costs. The amount of EBITDA is Rs. 11,27,000 (12,50,000 – 1,23,000).
Companies with higher EBITDA in relation to their sales are better than companies with lower EBITDA in relation to sales.
Depreciation/Amortization
Depreciation is the planned and gradual reduction in the value of a fixed asset over its useful life. Depreciation is applied to fixed assets like cars, computers, machinery etc, as these assets lose their value as well as utility over the years.
Amortization works on the same principle as depreciation and is applied to intangible assets like patents, copyrights etc.
Let’s say Navya buys a new car for Rs 6,00,000 at the start of the year for business use. If after using it for a year she attempts to sell the same at the end of the year, the resale value will definitely be lower than the purchase price of Rs 6,00,000. The resale value is the depreciated value of the car and the difference between the original purchase price and the resale price is the amount of depreciation. Even if Navya does not want to sell the car, she will reduce the value of the car each year in her books and mark the amount of reduction in her profit and loss statement as depreciation expense. Let’s assume that Navya marks Rs.60,000 each year as depreciation; the quarterly depreciation will be Rs.15,000.
While industrials, utilities and insurance companies mark depreciation, banks usually have very few fixed assets and hence do not mark depreciation.
PBIT
PBIT stands for profit before interest and taxes and is calculated as the difference between EBITDA and depreciation & amortization.
Navya’s PBIT is Rs.11,12,000 calculated as 11,27,000 minus 15,000.
Interest & Other Items
Interest expense refers to the amount of interest paid by the business on borrowed funds. Suppose Navya had borrowed Rs.12,00,000 from a bank at an interest rate of 10% per annum to fund her business. Rs.1,20,000 (10% * 10,00,000) is the annual interest expense and Rs.30,000 is the interest expense each quarter.
PBT
PBT stands for profit before taxes and is derived by subtracting interest & other items from PBIT. In Navya’s case PBT will be Rs.10,82,000 (11,12,000 – 30,000).
Taxes & Other Items
This is the tax on profit earned that a company owes to the government. This tax is very similar to the income tax that an individual pays on his income. In India, a flat 25% tax is levied on profits earned by domestic companies.
Navya’s pizza company has earned Rs.10,82,000 profit before tax during the first quarter. Assuming a 25% tax rate, the tax amount will be Rs.2,70,500 (10,82,000 * 25%).
Net Income
Net income is the profit earned by the company from its business operations after accounting for all operational & non operational expenses, interest costs and taxes. It is the amount of money that is available to the shareholders of the company after accounting for all kinds of cost associated with running a business venture.
Navya earned a net profit of Rs 8,11,500 (10,82,000 – 2,70,500) during the first quarter of the year.
Companies with higher net income in relation to their sales are better than companies with lower net income in relation to sales.
EPS
Calculating earnings per share (EPS) involves 2 different items–net income and total common shares outstanding. EPS is calculated as net income divided by total common shares. It represents the portion of a company’s profit that can be allocated to each outstanding common share of the company. The higher the earnings per share of a company, the better is its profitability.
Companies that are able to increase their earnings per share year after year are desirable.
Navya’s company, Roma has issued 10,000 shares of common stock and the net profit earned during the first quarter is Rs.8,11,500. Hence, the EPS is Rs.81.15 (8,11,500 / 10,000).
DPS
When a company earns profits, it can either decide to retain the same and invest it in the business or distribute the profits to the shareholders of the company. This distributed profit is called dividend. Dividend per share (DPS) is calculated as total dividend divided by total common shares. It represents the portion of a company’s profit that has been paid out to each outstanding common share of the company.
From the previous example, we have seen that common shares outstanding is 10,000 and the EPS is Rs.81.15. Suppose the company decides to pay 25% of its EPS as dividends, the DPS would be Rs.20.3 (81.15 * 25%).
Payout Ratio
Payout refers to the amount of profits of the company that has been paid out as dividends and has not been utilised in the business.
Payout ratio is calculated as dividend per share (DPS) divided by earnings per share (EPS) and is typically expressed as a percentage. Suppose the EPS is Rs.10 and Rs.2 is paid out as DPS, the payout ratio would be 20% (2 / 10 *100).
Research & Development
Research & development (R&D) expense refers to the cost associated with the research & development of a company’s goods and/or services. R&D activities involve conducting systematic research in order to attempt to discover specific solutions to a problem or create a new product.
R&D expense is usually very high in fields like pharma, oil & gas and specific kinds of technological firms. When assessing companies from these sectors, it is important to check whether R&D expense on an absolute basis as well R&D expense in relation to sales is increasing or at least stable. A company that does not invest sufficiently in R&D will lose its competitive advantage over a period of time as it will not be able to develop any new product or service.
Selling/General/Administrative Expenses
As the name suggests, selling, general and administrative expense (SG&A) refers to the expenses incurred in administering a business as well as selling the products/services created by it.
General & administrative costs include all expenses incurred in operating a business other than the cost directly incurred in producing the product sold or services rendered. Items like salaries of top executives & office staff, rent of office building, auditor fee etc. are part of this head.
Selling expense includes the cost of advertising and other promotional expenses.
Interest Income
Interest income is the sum of all interest earned by the bank either via any kind of lending or investing activity. This includes interest & fees on loans made out, interest & dividends from investment in various securities, interest income earned from deposits with other institutions, returns earned on trading account security etc.
A bank/financial institution (FI) that is able to increase its interest income every year is desirable.
Total Interest Expense
The item total interest expense is specific to banks and non-banking financial institutions. It is the sum of interest paid on deposits from customers as well as interest paid on borrowings from other sources via bonds & notes issued.
A bank/financial institution (FI) that is able to maintain or decrease its interest expense, every year, in relation to its interest income is desirable.
Net Interest Income
Net interest income is specific to banks and non-banking financial institutions and is defined as the difference between interest income, bank and total interest expense. It is the difference between the sum of all interest incomes of the bank and the sum of all of its interest expense.
Loan Loss Provision
Loan loss provision refers to the provision created for possible default on loans given out by the bank or financial institution.
Banks and financial institutions lend to a wide range of customers like individuals, medium & small enterprises (MSME) and giant corporations. Due to a range of reasons, some of these loans might not be returned, i.e they might turn bad and in other cases, loans might not be returned on time. Hence, in order to cover these possible losses, the bank sets aside a portion of the repaid loan amount. The loan loss provision acts as an internal insurance fund.
Net Interest Income after Loan Loss Provision
This amount is the difference between net interest income and loan loss provision. It indicates the gains from loan operations of the company after considering the cost of the loan and providing for unexpected losses via loan loss provisions.
1W Change in Call OI
1w change in call open interest is calculated as percentage change between current days call OI and the call OI 5 trading days ago. Suppose current day’s call OI is 120 and the call OI 5 trading days ago was 98, 1w change in call OI is 22.44% ((120/98) – 1)*100.
A positive change in call OI indicates that more people have bought call contracts compared to 5 days ago. This suggests that participants are bullish on the stock. On the contrary if the output is negative it indicates that investors have squared off their open positions and are not confident about the future price rise.
Introduction to Futures
Let’s start with a small story that will allow us to better understand the working of futures market. Two women, Sita and Noor are both active in the housing market of Mumbai. Sita is looking to buy a 2 bedroom apartment. Noor is planning to sell her 2 bedroom apartment for about Rs.1 crore and utilize the proceeds to set up a catering business.
Sita does like Noor’s apartment but is not able to pay immediately. Her money is locked in fixed deposit which will mature in 6 months and Sita does not want redeem it before the maturity date. However she wants to seal the deal and agree on the purchase consideration as she is concerned that prices might go up in the future. Noor is also keen to seal the deal. However since she has not yet found another rented accommodation to move into, she wants some grace time before handing over the possession of the apartment to Sita. Hence Sita enters into an agreement with Noor to buy the house after six months for a consideration of Rs 1.1 Crore. This way both were able to achieve their respective objectives.
This is a basic futures contract. Sita has agreed to buy the house and hence holds the long position. Noor has agreed to sell the house and hence holds the short position. A long position holder buys the “underlying” asset whereas short position holder agrees to sell the asset.
What is an underlying asset though? An underlying asset is an item that has been agreed to be bought or sold. In the above example the underlying asset is the 2 bedroom apartment. Futures are more standardized contracts which are traded on exchanges and have underlying’s like stocks, bonds and commodities
Now let’s look at some technical aspects of the futures contract in the other chapters of the module.
Fair Value
The price at which Sita agreed to buy the apartment from Noor was Rs.1.1 crore. This is the price that Sita will pay at the expiry/maturity of the contract after 6 months. But is this the fair price, assuming the same apartment can be bought today for Rs 1 crore?
Let’s assume that the current bank interest rate is 6% pa. Keeping things simple and not counting in compounding, Sita will be able to earn 3% returns in 6 months on her investment. So if Sita invests Rs 1 crore in the bank today, she will have Rs 1.03 crore after 6 months. This is called the Fair Value of the futures contract. If the future contract was priced at Rs 1.03 crore, instead of Rs 1.1 crore, Sita would have been indifferent in buying the house today or after six months.
Simply put, fair value of any future contract is the amount that you will have at maturity of the contract, if you simply invest an amount equivalent to the current underlying price in the bank and earn the risk free rate on it.
*We use 3month MIBOR for all our calculations
Future Close Price
As mentioned above, futures are standardized contracts on stocks and/or bonds, traded on exchanges. In the screener you will find data regarding future contracts for different stocks traded on NSE – National Stock Exchange.
Just as in stock prices, future contract prices are also determined by demand and supply pressures of market. If there are too many people buying the future contract of Reliance, its price will go up. Similarly, if there are too many traders selling the future contract of HDFC, its price will come down. This price will always remain close to the fair value which we determined above, but might vary depending upon the current market demand and supply. In our example of Sita and Noor, at 1.1 crore future contract price is different from the fair value price of Rs 1.03 crore.
The future close price that you see in the screener is the closing price of the current month future contract from the last day it got traded on the exchange. So if you are checking the future close price of the Reliance contract today, it will be the closing price of the contract yesterday (previous traded day).
Lot Size
In our example, both parties entered into a futures contract to buy/sell a single apartment, hence the lot size is 1. Suppose they had entered into a futures contract that required buying/selling 2 apartments then the lot size would have been 2 and so on.
In the stock futures market, lot size refers to the number of shares of the company contained in one contract and which an investor is required to buy in a single transaction. For example, suppose the lot of size of Asian Paints is 600, then purchasing a single future contract of Asian Paints would involve 600 shares of the company. This lot size is not divisible. The stock exchange specifies the lot size and it is different for different stocks/commodities.
Future Open Interest
Let’s move beyond the example of Sita and Noor and consider the entire housing market of Mumbai. Just like the before mentioned characters, suppose 12 other people have agreed to buy houses from 12 other sellers after 6 months. So the total number of futures contract that are open is 12+1 = 13. Suppose 2 days later another futures contract is signed, then the open interest increases by 1 to 14. Now let’s assume Sita sells her futures contract to her friend Rita, who is also interested in buying Noor’s apartment. The contract is now between Noor and Rita. However the number of open interest’s still remains at 14 as Rita merely took Sita’s position as the buyer and did not enter into a new contract.
If out of the 14 open contracts one of the set of buyers and sellers execute the transaction i.e buy/sell the house, the number of open interest drops by 1 to 13.
Hence when an investor who has bought / sold a futures contract does not complete the transaction by subsequently selling / buying the contract or actual delivery or receipt of the stock / commodity, the contract is said to be “open”. Open interest (OI) is the number of futures contract that are yet to be settled and exist on the books of the clearinghouse / stock exchange
A single purchase and sale, involving two transacting parties – constitutes an OI of 1. OI is a measure of the flow of money into futures market. Increasing OI represents new or additional money flowing into the market. Decreasing OI indicates money flowing out of the market.
1D Change in Future OI
This is percentage change in open interest between 2 subsequent trading days. Suppose the open interest (OI) position on Monday is 100 and on Tuesday is 120, 1 day change in OI is calculated as (120/100) – 1*100 = 20%. A positive output indicates rising number of OI’s whereas a negative output indicates drop in OI’s.
As a rule of thumb, if the spot price of the stock and OI of futures both move up, it indicates a bullish signal and prices might continue to rise. A decrease in price with an increase in OI or conversely an increase in price with a fall in OI both indicates a bearish signal.
1W Change in Future OI
The data item is calculated as percentage change in OI between 5 trading days. Suppose the open interest (OI) position on Friday is 100 and on last Friday it was 170, 1W change in OI is calculated as (170/100) – 1*100 = 70%. A positive output indicates rising number of OI’s whereas a negative output indicates drop in OI’s.
As a rule of thumb, if the spot price of the stock and OI of futures both move up, it indicates a bullish signal and prices might continue to rise. A decrease in price with an increase in OI or conversely an increase in price with a fall in OI both indicates bearish signal.
Future Volume
Volume refers to the total number of future contracts that have been executed on the stock exchange on any given trading day
Let’s look at the same example which we discussed in the Future Open Interest section. Initially open interest was 1, as the only contract was between Sita and Noor. The next day 12 new contracts were opened between 12 different sellers and buyers, and the total open interest increased to 13. On this day the volume was 12, as 12 contracts got executed, however open interest was 13 as these are the number of open contracts.
Next day one more contract got opened between a new buyer and seller. Thus the open interest became 14, but the volume for that day was just 1 as only one contract got executed. The purchase by the buyer and sale by the seller of one futures contract equals a volume of 1.
For example if you see that the Volume for the near month Reliance future contract on the screener as 120,000, it means these many contracts were executed on the previous trading day.
1D Change in Volume
This is percentage change in total traded volume between 2 subsequent trading days. Suppose the total volume on Monday is 100 and on Friday it was 120, 1 day change in volume is calculated as (120/100) – 1*100 = 20%. A positive output indicates rising number of volumes whereas a negative change indicates drop in volumes.
Change in volume needs to be viewed in conjunction with price change and open interest change. Rise in price accompanied by increase in open interest and volume traded is a bullish signal. Rising price accompanied by falling open interest and volume as well as falling price accompanied by rising open interest and volume are both signals of bearish trend.
1W Change in Volume
The data item is calculated as percentage change in total traded volume between 5 trading days. Suppose the traded volume on Friday is 100 and on last Friday it was 170, 1W change in volume is calculated as (170/100) – 1*100 = 70%. A positive output indicates rising number of volume whereas a negative output indicates drop in volume.
Change in volume needs to be viewed in conjunction with price change and open interest change. Rise in price accompanied by increase in open interest and volume traded is a bullish signal. Rising price accompanied by falling open interest and volume as well as falling price accompanied by rising open interest and volume are both signals of bearish trend.
Basis
Basis is the difference between the current price of the future contract and the current price of the underlying. In our example of Sita and Noor, we established that the fair value of the futures contract is Rs 1.03 crore and the price at which the future contract got executed between Sita and Noor was Rs 1.1 crore. Let’s assume that 1.1 crore is the current market price. This means that if Sita wants to sell her position in the contract there are buyers who will be willing to pay her Rs 1.1 crore to enter into the futures contract with Noor.
Let’s say Sita sells her future contract to Karishma for Rs 1.1 crore. Thus in this case, now the contract is between Karishma and Noor with Karishma holding the long position. Open Interest remains the same, as no new contract was created. Let’s say the price to buy the house today is Rs 1 crore. Thus, basis would be Rs 10 lakh (1.1 – 1), as it represents the difference between the current market price of the future contract and the current price of the underlying.
Fair Value Spread
Fair value spread is the difference between fair value and the current market price of the future contract. We have already understood the meaning of fair value and current future price. In our example of Sita and Noor, fair value of the house was Rs 1.03 crore and the current market price was Rs 1.1 crore, so the fair value spread would be – 70,000 (1.03 – 1.1).
Fair Value spread can be used to detect arbitrage opportunities in the market. A positive fair value spread highlights cash and carry arbitrage opportunity and a negative value indicates reverse cash and carry arbitrage opportunities. Read more about cash and carry arbitrage here.
Rollover cost
In the example of Mumbai housing market the contract was valid for a period of 6 months. However in case of futures contracts traded on national stock exchange, the contracts are available in 1 month, 2 month and 3 month time frame. The time frame up to which the contract lasts is called ‘The expiry’ of the contract.
Suppose Sita wants to enter into a 6 month contract with Noor on the stock exchange she will have to buy a futures contract with 3 months validity and then at expiry again buy a 3 month contract. This is called rolling over the position. It refers to carrying forward a particular periods future contract position to the next month. This can be done by selling the contract which is about to expire and buying the new longer contract
Suppose investor X is bullish about Nifty futures, when his current month contract is due for expiry he will exit the position and buy the subsequent month’s contract rolling over his position.
Rollover cost is calculated as the percentage change between futures contract price for the next month and the futures contract price for the current month contract. For example let’s assume X holds 10 futures contract of Ashok Leyland that is expected to expire at the end of this month. Price of each contract is Rs.94.35. He decides to roll over his position. Price of each contract for next month expiry is Rs.95.45 and he needs to buy 10 contracts to carry forward his position.
Rollover cost = ((95.45 / 94.35) -1 )*100 = 1.2%
It means he will get 10 * 94.35 = 943.5 by selling the current month contract, but when he buys the 10 lots of next month contract he will pay 10* 95.45 = 954.5. Thus he will pay an additional cost of 954.5 – 943.5 = 11 which is 1.2% of his current investment ie. 943.5.
Percentage Rollover
As discussed earlier, rollover refers to carrying forward a particular month’s derivative position to the next month. Rollover data allows to understand how much of current month’s open interest positions in futures, are being carried forward to the next month series.
Rollover percentage is calculated as open interest for the next month divided by the open interest of the futures contract across all periods. For example suppose open interest position of Ashok Leyland futures are as below:
| Near month | Mid month | Far month |
|---|---|---|
| 5,50,83,000 | 34,30,000 | 28,000 |
A high rollover percentage indicates that a lots of positions are being carried forward to the next month and traders are still holding onto their belief about the direction of stock’s movement. On the contrary, a low rollover percentage indicates lack of confidence about the future direction of the underlying stock or commodity.
Rollover percentage = 34,30,000 / (5,50,83,000 + 34,30,000 + 28,000) = 5.9%
Calendar spread
Let’s assume that the futures contract for houses in Mumbai is trading on the stock exchange. Currently contracts are open for July expiry (near month), August expiry (mid month) and September expiry (far month). The difference between the August future contract price and July future contract price is called the calendar spread
If prices of distant delivery futures contract are higher than near delivery futures contract, it results in positive calendar spread and such a situation is called contango market. For example in the above example if the price of August futures is higher than the price of July futures, it is called contango. Conversely if in the above example if the price of July futures contract were higher than price of August futures contract, it would result in negative spread and is called backwardation.
Options
Let’s continue with the same example which we discussed in the Futures section. In the example, Sita had agreed to buy Noor’s 2BHK flat after 6 months at a price of Rs 1.1 crore. Let us modify the example slightly to understand options. Recall that though Sita likes Noor’s apartment and is keen on buying it, as her money is locked in fixed deposit maturing in 6 months she is not able to pay for the apartment immediately. Sita is also concerned that house prices will rise in the future and is keen to lock in the price as of today. Noor is selling the house so that the proceeds can be utilized to set up a catering business. She is also keen to seal the deal with Sita, but needs some time to find a suitable rented accommodation. Thus it made sense for both of them to enter into a futures contract executable after 6 months.
Let’s suppose Noor is keen to sell the apartment right away and move out. If she has to wait for 6 months to receive the purchase consideration and vacate the apartment, then Noor expects to be adequately compensated for the same. The compensation is because Noor will have to maintain the apartment for 6 months and is liable to pay property taxes, maintenance expenses etc. Let’s assume Sita agrees to pay Rs.5 lakh immediately to Noor. By doing so, Sita is buying the right to buy Noor’s apartment after 6 months at a predetermined price of Rs 1.1 crore and Noor is charging her some premium to grant this right. This is an example of call option. Sita is entering into a call option with Noor, this gives her the right to buy Noor’s apartment after 6 months; this is called the long position. Noor is giving Sita the right to buy her apartment and holds the short position. Predetermined price of the underlying apartment is called strike price. In this example strike price of the call option is Rs 1.1 crore and maturity period is 6 months.
Call Open Interest
Let’s take our example further. Just like Sita and Noor, suppose 12 other people have agreed to buy houses from 12 other sellers after 6 months. They have also paid a premium to enter into these call option contracts. So the total number of call option contract that are now open is 12+1 = 13. Suppose 2 days later another call option contract is signed, then the open interest increases by 1 to 14. Now let’s assume Sita sells her call option contract to her friend Rita, who is also interested in buying Noor’s apartment. The contract is now between Noor and Rita, however the number of open interest still remains at 14 as Rita merely took Sita’s position as the buyer and did not enter into a new contract.
Hence when an investor who has bought/sold a call option contract does not complete the transaction by subsequently selling / buying the contract, the contract is said to be “open”. Open interest (OI) is the number of contract that are yet to be settled and exist on the books of the clearinghouse / stock exchange.
A single purchase and sale, involving two transacting parties – constitutes an OI of 1. OI is a measure of the flow of money into option market. Increasing OI represents new or additional money flowing into the market. Decreasing OI indicates money flowing out of the market.
Call OI that you see on the screener is the sum of all open call contracts across all the strike prices for all expiry periods. Suppose 15 call options are open across all strike prices that are set to expire this month. Similarly 27 call options are open that will expire next month and 8 open call options will expire the month after that. The total call option open interest is 50 (15+27+8).
Put Open Interest
We have already understood the concept of open interest. Now let’s understand a put option. We have already explained that access to the right to buy is a call option. In our example Sita got the right to buy Noor’s house and we established that she holds a long position in a call option contract. Opposite of right to buy is the right to sell and this is called a put option. In this case, the buyer of the option will pay a premium to seller of the option to get a right to sell.
Always remember that the option lies with the buyer of the call/put contract. Call option buyer has the right to buy and thus an option to buy or not, as per her wish. But if she wants to buy, seller of the option is obligated to sell the underlying. This is the reason buyer of the option is paying a premium to get this right. Similarly, in the case of put option, buyer has the right to sell the underlying and thus the option to decide if she wants to sell the same or note. But if she wants to sell the underlying, seller of the put contract is obligated to buy the underlying.
Put open interest is the sum of open put contracts across all strike prices for all expiry periods. Suppose 8 put options are open across all strike prices that are set to expire this month. Similarly 12 put options are open that will expire next month and 3 open put options will expire the month after that. The total put option open interest is 23 (8+12+3).
1D Change in Call OI
1D change in call open interest is calculated as percentage change between current days call OI and the previous days call OI. Suppose current days call OI is 113 and the previous days call OI is 100, 1D change in call OI is 13% ((113/100) – 1)*100.
A positive change in call OI indicates that more people have bought call contracts compared to previous day. This suggests that participants are bullish on the stock. On the contrary if the output is negative it indicates that investors have squared off their open positions and are not confident about the future price rise.
1D Change in Put OI
1d change in put open interest is calculated as percentage change between current day’s put OI and the previous day’s put OI. Suppose current day’s put OI is 89 and the previous day’s put OI is 75, 1d change in put OI is 18.67% ((89/75) – 1)*100.
A positive change in put OI indicates that more people have bought put contracts compared to previous day. This indicates that market participants expect the price of the stock to fall and are buying put options to protect the downside to the stock. On the contrary if the output is negative it indicates that investors have squared off their open put positions and are not fearful about the price fall.
1W Change in Put OI
1w change in put open interest is calculated as percentage change between current day’s put OI and the put OI 5 trading days ago. Suppose current day’s put OI is 91 and the put OI 5 trading days ago was 82, 1w change in put OI is 10.97% ((91/82) – 1)*100.
A positive change in put OI indicates that more people have bought put contracts compared to previous week. This indicates that market participants expect the price of the stock to fall and are buying put options to protect the downside to the stock. On the contrary if the output is negative it indicates that investors have squared off their open put positions and are not fearful about the price fall.
Highest Call OI Strike
Strike price is the price at which that specific derivative contract can be executed. In case of call option, strike price is the price at which the call buyer can buy the stock. Whereas in case of put option, strike price is the price at which the put buyer can sell the stock. In our example of the call option contract between Sita and Noor, strike price was Rs 1.1 crore.
Generally retail clients take long position in the option contracts and institutions take the short position. Strike with highest call OI indicates the price level at which institutions have sold a lot of call options, thus it means institutions don’t feel that price will go above this particular level. This level indicates the maximum upside. For example if in case of Maruti, Rs.7800 represents the strike with highest call OI, then it means that institutions expect the price to remain below 7800.
Highest Put OI Strike
We have already explained the concept of OI and strike price above. As mentioned earlier, retail investors generally take the long position and institutions short the option contracts. Strike with highest Put OI indicates the price level at which institutions have sold/written a lot of put option contracts. Thus, it means that they expect price to not fall below this level. For example, if Rs.7200 represents the strike with highest put OI for Maruti, then it means that institutions expect the price to not fall below Rs.7200.
Highest 1D/1W OI Change CE Strike
The OI percentage difference for a particular strike price between 2 subsequent trading days is first calculated. Suppose Union Bank of India has 3 different strike prices: Rs.162, Rs.165 and Rs.168.
| Strike price | Call option OI on Monday | Call option OI on Tuesday | 1 day percentage change in OI |
|---|---|---|---|
| Rs.162 | 1820 | 1953 | 7.30% |
| Rs.165 | 2789 | 3586 | 28.57% |
| Rs.168 | 1758 | 1548 | -11.94% |
In the above example Rs.165 strike price has the highest call option OI as well as recorded the highest percentage increase in OI over the previous day.
The same exercise done for 2 days separated by 5 trading days results in the highest 1W OI change call option strike. The maximum increase in percentage change is sought out and this is the strike with the highest call OI change.
Highest 1D/1W OI Change PE Strike
The OI percentage difference for a particular strike price between 2 subsequent trading days is first calculated. Suppose Union Bank of India has 3 different strike prices: Rs.162, Rs.165 and Rs.168.
| Strike price | Put option OI on Monday | Put option OI on Tuesday | 1 day percentage change in OI |
|---|---|---|---|
| Rs.162 | 1200 | 1322 | 10.16% |
| Rs.165 | 1892 | 2010 | 6.23% |
| Rs.168 | 798 | 763 | - 4.39% |
In the above example though Rs.165 strike price has the highest put option OI, over the previous day Rs.162 strike price has recorded the highest percentage increase in OI.
The same exercise done for 2 days separated by 5 trading days results in the highest 1W OI change put option strike. The maximum increase in percentage change is sought out and this is the strike with the highest put OI change.
Put Call Ratio
The put call ratio is calculated by dividing the total open interest in put options of an underlying by the total open interest in call options of the underlying. Suppose the OI of put options on stock ABC is 120 and the OI of call option on the same stock is 100, put call ratio will be 1.2 (120/100).
Put call ratio is used to understand the mood of the options market. A high put call ratio indicates that open interest in put options are more than the open interest in the call option and sentiment is bearish in the market. Similarly a low put call ratio indicates that open interest in call options is more and the market sentiment is bullish. Thus, it is important to determine what is considered as high and low for the put call ratio. One can track the historical ratio and then compare the same with the current number to determine or gauge the sentiment around a stock or index.
screener Filters
This module describes all the filters used in screener
You can add these Filters in your screener by clicking the Add Filter button on the bottom left
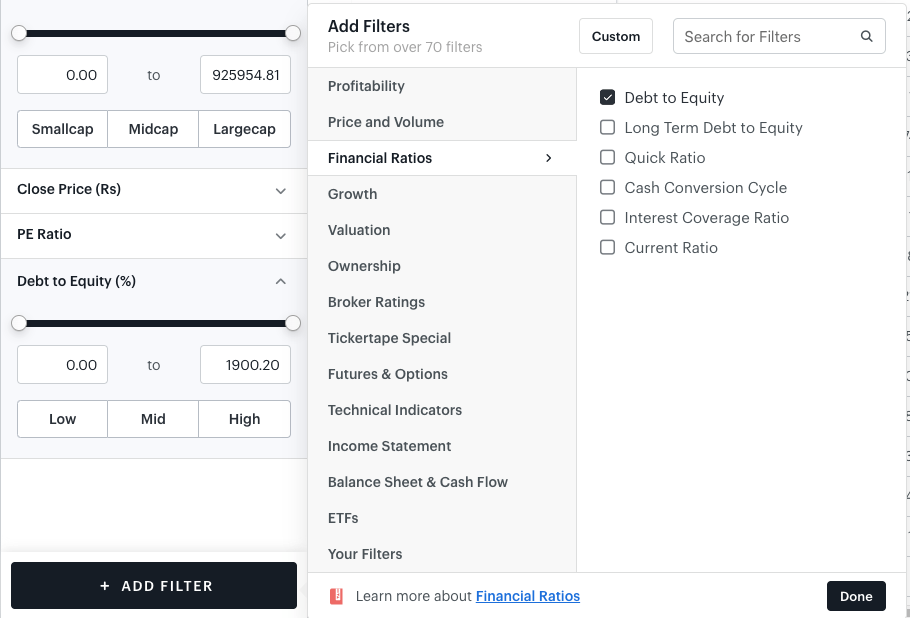
In order the Filter categories appear on screener
Happy screening!
Alpha
The data item is calculated as the excess return of the stock over and above the corresponding benchmark returns. The data item is calculated using 104 weekly price close points
Benchmark is the standard against which performance of a security is measured. For example if one were to analyse the stock price performance of HDFC Bank over the previous year, just saying the stock moved up 17.3% will not give us the correct picture. It is important to compare the returns with the either Nifty 50 returns or Nifty Bank returns. Suppose we choose Nifty Bank as the benchmark, which has moved up 12% over the previous year. We can then conclude that price performance of HDFC Bank over the previous year has been better than the corresponding benchmark index. Alpha in this case is (17.3 – 12.0) = 5.3%
Beta
Beta is a measure of a company’s stock price risk in comparison to the market
A company’s stock price faces 2 different kinds of risk. The first one called the “unsystematic risk” is specific to the company and affects only the specific company. For example labor dispute in Maruti Suzuki will affect only shares of the company and not other shares in the market. However natural calamity, political instability etc. will affect all the participants in the market and hence is called “systematic risk”. Beta is a measure of systematic risk and indicates the extent to which the stock price will move in comparison to the market
Companies whose beta is greater than 1 are classified as “high beta stocks”. The stocks of such companies are very volatile and move up or down a lot more than index prices. If the investor is foreseeing a bull run in the market, investing in such stocks might increase the possibility of better than market returns. “Low beta stocks” have beta less than 1 and are less volatile. Prices of such stocks are subdued when compared to index prices. These stocks usually act as safeguard against price drop in a bear market
Sharpe Ratio
The ratio helps understand the excess return earned on the stock over and above the benchmark rate of return for a single unit of risk. The data item is calculated using 104 weekly price close points. Before understanding Sharpe ratio, it is important to know more about benchmark. Benchmark is the standard against which performance of a security is measured. If one were trying gauge the performance of a banking stock like Indusind Bank, it could be compared with Nifty Bank. Similarly auto stocks could be compared with Nifty Auto
Let’s assume investor P buys 100 stocks of company XYZ on 1st Jan 2016 at Rs.40/share. On 1st Jan 2017 the price of the stock has risen to Rs.57. So 1 year return of the stock is (57/ 40) – 1 = 42.5%. During the same period benchmark index moved up 5% . Standard deviation (risk) of the excess returns of XYZ over BM is 28%. Sharpe ratio is then calculated as (return on the stock – return on the benchmark index) / (standard deviation of the excess returns of the stock over benchmark)
(42.5% – 5%) / (28%) = 1.34
So the investor earned 1.34% excess return over the benchmark return for every 1% of risk that he had to bear.
One can use sharpe ratio to compare the risk adjusted returns of different stocks. Other things remaining the same the stock with the higher sharpe ratio is obviously the better one
Relative Volume
Often called RVOL, this ratio displays the average volume of the stock over the previous 10 days divided by the average volume of the stock over the previous 91 days.The ratio helps understand how in demand the stock has been in past few days
Suppose the 10 day average volume is 10,000 and the 90 day average volume is 4000, then relative volume is 10,000/4,000 = 2.5. RVOL above 2 is considered to be a signal of high demand for the stock and when a stock is in demand, price tends to moves up very quickly
Volatility
The data item is calculated as the annualised standard deviation of the daily price change for the 200 most recent trading days. Suppose we have 2 batsmen, A and B. Scores of A and B in the previous 5 matches are as below:
| Match 1 | Match 2 | Match 3 | Match 4 | Match 5 | Total | Average | |
|---|---|---|---|---|---|---|---|
| Player A | 32 | 12 | 57 | 112 | 3 | 216 | 43.2 |
| Player B | 11 | 92 | 18 | 43 | 37 | 207 | 40.2 |
As can be seen, both players have on an average scored about 40 runs per match in the previous 5 matches. However average score does not allow us to understand who amongst the 2 players is more consistent. This can be understood by studying the difference between individual scores and the average score of each player. Standard deviation is a measure of how far each number is from the average. The closer the numbers are to the average, the more consistent the batting performance is.
| Average | Standard deviation | |
|---|---|---|
| Player A | 43.2 | 43.70 |
| Player B | 40.2 | 31.80 |
We have calculated the standard deviation with the help of excel. As can be seen player B, has slightly lower average than A. However his standard deviation is significantly lower than that of A, indicating more consistent performance and hence lesser risk of not performing. In the case of stocks we define volatility as riskiness of the stock and is measured using standard deviation. Higher the standard deviation, greater the volatility and vice versa.
Volatility vs Nifty
This data item is calculated as the difference between the annualised standard deviation of the stock minus the annualised standard deviation of the Nifty
Standard deviation of a stock or index is a measure of its volatility/riskiness. A positive number indicates that the stock is more volatile than the index and is more likely to see extreme price movements when market experiences a shock and moves up or down rapidly. A negative number indicates the opposite
Volume weighted average price
Volume weighted average price (VWAP) is calculated by adding the Rupee amount traded for every transaction and dividing this by the total shares shares traded for that particular day. Rupee amount is calculated as price multiplied by the number of shares traded. Formula is as below:
VWAP = Sum of (number of shares bought * price at which share bought) / Total shares bought
Average price calculated using VWAP is not just based on closing price of the stock and factors in the volume of transactions at a specific price point as well.
VWAP is used as reference point to understand the price at which the security should be bought or sold. It is good to buy a security when it is trading below the VWAP. Similarly it is smart to sell the security when it is trading above the VWAP.
Percentage Price above 1M SMA
The data item is defined as the percentage difference between close price of the stock and the simple moving average of close price of previous 20 trading days. Suppose current stock price is Rs.30 and previous 20 trading day average price is Rs.28, the data item is calculated as (30/28) – 1 = 7.14%. This is one of the most basic types of technical indicator and helps understand the momentum of the stock. Price momentum is the rate of change in price of a particular stock
Momentum investing is a strategy that tries to understand the existing trend in the market and attempts to capitalize on the same. So if a momentum investor feels that the bull run in the market will continue, he/she will buy stocks whose prices are increasing in order to benefit from the trend. If he/she feels that the market is in bear phase and stocks will continue to go down, he/she will sell stocks with negative momentum in order to gain from the trend. Once the momentum investor identifies the trend he/she can use the percentage price above 1M SMA to shortlist stocks that have either been trending higher or dropping down
Percentage Price above 12M SMA
The data item is defined as the percentage difference between close price of the stock and the simple moving average of close price of previous 250 trading days. Suppose current stock price is Rs.30 and previous 250 trading day average price is Rs.22.7, the data item is calculated as (30.0/22.7) – 1 = 32.2%. This is one of the most basic types of technical indicator and helps understand the momentum of the stock. Price momentum is the rate of change in price of a particular stock
Momentum investing is a strategy that tries to understand the existing trend in the market and attempts to capitalize on the same. So if a momentum investor feels that the bull run in the market will continue he/she will buy stocks whose prices are increasing in order to benefit from the trend. If he/she feels that the market is about to enter bear phase, then it makes sense to sell stocks that have been falling in order limit losses
Once the momentum investor identifies the trend he/she can use the percentage price above 12M SMA to shortlist stocks that have either been trending higher or dropping down. If the investor is analyzing short term trend then it makes sense to use 1M SMA and when he/she is analyzing long term trends, it’s better to use 12M SMA
Percentage price above 1M EMA
The data item is defined as the percentage difference between the close price of the stock and the exponential moving average of close price over the previous 1 month. Suppose current stock price is Rs.30 and previous 1 month exponential average price is Rs.28, the data item is calculated as (30/28) – 1 = 7.14%.
The exponential moving average (EMA) helps understand the momentum of the stock. An EMA is very similar to simple moving average, however the former gives more weight to the latest data. Because of this, EMA is more sensitive to recent price changes compared to simple moving average. A rising EMA shows that prices are generally increasing and vice versa if EMA is falling.
Price momentum is the rate of change in price of a particular stock. Momentum investing is a strategy that tries to understand the existing trend in the market and attempts to capitalize on the same.
If a momentum investor feels that the bull run in the market will continue, he/she will buy stocks whose prices are increasing in order to benefit from the trend. If he/she feels that the market is in bear phase and stocks will continue to go down, he/she will sell stocks with negative momentum in order to gain from the trend. Once the momentum investor identifies the trend he/she can use the percentage price above 1M EMA to shortlist stocks that have either been trending higher or dropping down.
Value Momentum Rank
The data item is a percentile ranking (ranking between 0 -100) of the stock, against all other stocks in the country, based on recent valuation as well as price momentum of the stock. The rank is calculated taking into consideration 2 different factors:
- Valuation of the stock : Valuation of a stock refers to an attempt to understand the true worth of the stock. Valuation is done taking into consideration the expected future growth of the company vis a vis its historical growth as well when compared to expected industry growth.
- Momentum of the stock : Price momentum is the rate of change in price of a particular stock. Momentum investing is a strategy that tries to understand the existing trend in the market and attempts to capitalize on the same. So if a momentum investor feels that the bull run in the market will continue he/she will buy stocks whose prices are increasing in order to benefit from the trend.
A company might be trading at discount to the sector either because the stock’s future earnings potential are low or because market has not noticed its earnings potential and hence there is a temporary pricing mismatch. Combination of valuation and momentum factors, in the above data item, helps differentiate between stocks that are undervalued due to fundamental issues and ones that are genuinely undervalued and gaining favour with investors
Higher the rank, stronger the value momentum of the stock. For example an overall score of 95 indicates that the stock is better than 95% of it’s peers
Price Momentum Rank
The data item is a percentile ranking (ranking between 0 -100) of the stock, against all other stocks in the country, based on recent historical price performance. The rank is calculated taking into consideration the price movement of the stock over the previous 12 months as well as the strength of price movement compared to its industry peers
As discussed earlier, price momentum is the rate of change in price of a particular stock. Momentum traders and investors believe that stocks that have trended up over the previous 3-12 months will continue to move up faster than the market over the next 3-12 month period. Hence buying stocks with higher price momentum might increase the possibility of earning higher price returns
Higher the price momentum rank, stronger the price momentum. So if the overall score is 97, it indicates that the security has better price momentum than 97% of the stocks
Earnings Quality Rank
The data item is a percentile ranking (ranking between 0 -100) of the stock, against all other stocks in the country, based on sustainability of earnings
The rank is calculated taking into consideration profit margin, efficiency of assets in generating sales, operating cash flow etc. Earnings quality is defined as the extent to which past earnings are reliable and are likely to persist. High earnings quality indicate that the company’s fundamentals are expected to further strengthen and vice versa. Higher the earnings quality rank, more likely the company is able to sustain its earnings
Price to Intrinsic Value Rank
The data item is a percentile rank of the stock, calculated based on the price to intrinsic value (IV) ratio of the stock against all other stocks in the country. Lower the P/IV of a company, higher the corresponding rank. So if a company has a rank of 98, it means that it is undervalued compared to 98% of the stocks. More undervalued a stock is, higher the upside potential
Intrinsic value refers to the investors’ perception about the actual value of the company. Different methods of calculating intrinsic value, taking into consideration earnings per share, cash flow or dividends per share are available
Fundamental Score
This data item is a Tickertape proprietary score between 1 and 10 assigned to stocks listed on NSE. The score helps rank the stock versus all other stocks in the respective sector. Higher the score, better the company. The score is calculated taking into consideration factors like valuation, profitability, market share growth, financial health and earnings growth of the company
For example – among personal product companies – Bajaj Corp is ranked the highest with a composite score of 7.50, Colgate Palmolive with a score of 5.05 ranks number 5 within the sector and Emami with a score of 3.83 is one of the lowest ranked stocks in the sector (Feb 2017)
Percentage Buy Recommendations
This data item is calculated as sum of strong buy / buy recommendations divided by the total number of recommendations for the stock. Stock brokers regularly put out their recommendations about particular stocks. These recommendations could be either strong buy, buy, hold, sell or strong sell. Each broker covering the stock will usually have one of these recommendations for that stock
Suppose 10 brokers are covering Maruti Suzuki, 3 of them have strong buy recommendation, 2 have buy recommendation, 1 has hold and the rest have sell recommendation. Percentage buy recommendation is calculated as (3+2) / 10 = 50%
Number above 50% is considered to be good because more number of brokers have strong buy / buy recommendation for the stock compared to hold or sell. Closer the number is to 100% the better, indicating higher confidence in the prospects of the stock
Percentage Upside
This data item is calculated as percentage difference between target price of the stock and the close price. Stock brokers project the expected price level of the stock over the near term. Average of all these projections for a particular stock is called target price of the stock. Suppose 3 brokers are covering stock XYZ and have projected the stock price to be Rs.112, Rs.128 and Rs.97 over the near term. Target price is calculated as (112+128+97) / 3 = Rs.112.33
Percentage difference between the target price and the current stock price shows the potential upside/downside in the stock. Suppose current market price of stock XYZ is Rs.88, we have calculated target price as Rs.112.33. Percentage upside is calculated as (112.33 / 88) – 1 = 27.65%. A positive number indicates potential upside whereas negative number indicates downside
RSI – 14D
Relative strength index (RSI) – 14D measures the speed and change of price movement over a 14 trading day period to determine whether a stock is in overbought or oversold range. RSI values range from 0 to 100. If the RSI is above 80, it is considered that a security is overbought zone or has run up too much and might fall soon. On the contrary if the RSI reading is below 20, it is considered that the security is oversold or has fallen too much and might see price reversal soon.
Relative strength is calculated using 14 trading days of price data. A simple average of daily price gains and daily price losses are compared with each other to calculate relative strength.
RSI Exponential – 14D
Relative Strength Index exponential (RSI) – 14D works just like RSI -14D and measures the speed and change of price movement to determine whether a stock is in overbought or oversold range. RSI exponential above 80 indicates that the stock has run up to much, whereas a reading below 20 indicates an oversold position
RSI exponential is calculated using exponential average of price close of stocks, for previous 14 tradable days. An exponential moving average is a type of moving average that is similar to a simple moving average, except that more weight is given to the latest data
ADX Rating – Trend Strength
Average Directional Index (ADX) is an indicator that measures the strength or weakness of the trend regardless of whether markets are moving up or down
ADX value is calculated over a 14 day period and ranges between 0 to 100. If the stock prices have been falling and the ADX value moves above 25, it indicates that the trend is strengthening and prices will continue to fall. If in a rising market ADX value moves above 25, it indicates continued bullishness. An ADX value below 20 indicates no trend.
Close Price
This is the close price of the stock on the last day it traded
1M Return
This is the percentage change in the company’s stock price over the previous 4 weeks
MACD Line 1 – Trend Indicator
Moving average convergence divergence (MACD) is a trend indicator that is calculated using difference between 12 and 26 day exponential price average (EPA) and tells whether a stock is in an uptrend or downtrend
An exponential moving average is a type of moving average that is similar to a simple moving average, except that more weight is given to the latest data. MACD is extremely helpful in spotting increasing short term momentum
A positive MACD line 1 value is caused when 12 day EPA is greater than 26 day EPA. This indicates increasing upward momentum. An increasing negative MACD line 1 output indicates that the downward trend is getting stronger
| Company | MACD Line 1 value |
|---|---|
| Infosys | -23.44 |
| Reliance Industries | 35.53 |
| HDFC Bank | 28.44 |
| Bharat Financial Inclusion | -4.65 |
As can be seen from the table above Reliance Industries and HDFC Bank have positive MACD line 1 values indicating short term uptrend in the stocks. In case of Infosys and Bharat Financial Inclusion the line 1 value is negative indicating that stock are in down trend
6M Return
This is the percentage change in the company’s stock price over the previous 26 weeks
MACD Line 2 – Signal Line Comp
Moving Average Convergence Divergence (MACD) Line 2 is calculated as the difference between moving average convergence divergence (MACD) indicator and signal line. A signal line is a 9 day exponential average of MACD line 1
A positive MACD line 2 value occurs when MACD line 1 value is greater than signal line value. There can be different interpretations of this value depending upon the absolute value of the MACD line 1. For example, if the MACD line 1 has a positive value, it means the stock is in uptrend. In this case, a positive line 2 value would mean a strong uptrend and a negative line 2 value would mean a weak uptrend. If the MACD line 1 has a negative value, it means the stock is in downtrend. In this case, a positive line 2 value would mean a weak downtrend and negative line 2 value would mean a strong downtrend
1Y Return
This is the percentage change in the company’s stock price over the previous 52 weeks
1M Return vs Nifty
This is the percentage change in the company’s stock price minus percentage change in Nifty over the previous 4 weeks
A positive output, when the market has moved up over the previous 4 weeks, indicates that the company’s stock price moved up at a faster pace compared to the pace of market movement. A positive output, when market has dropped during the previous 4 week, indicates that either the stock price moved up defying the market or it dropped at a slower pace than the market
A negative number indicates that either the market rose at a faster pace compared to stock price movement or dropped slower compared to stock price
6M Return vs Nifty
This is the percentage change in the company’s stock price minus percentage change in Nifty over the previous 26 weeks
| 6 month % returns | 6 month return vs Nifty | |
|---|---|---|
| Stock A | 12.0% | 4.7% |
| Stock B | -2.8% | -10.1% |
| Nifty | 7.3% |
As can been seen from the above table, if the returns on the stock is more than Nifty returns, then the output is positive. If the stock’s returns is lower than the Nifty returns the output is negative.
Price momentum is the rate of change in price of a particular stock. Momentum investing is a strategy that tries to understand the existing trend in the market and attempts to capitalize on the same. So if a momentum investor feels that the bull run in the market will continue he/she will buy stocks which have outperformed the index. If he/she feels that the market is about to enter bear phase, then it makes sense to sell stocks that have under performed the index
1Y Return vs Nifty
This is the percentage change in the company’s stock price minus percentage change in Nifty over the previous 52 weeks
| 12 month % returns | 12 month return vs Nifty | |
|---|---|---|
| Stock A | 12.0% | 4.7% |
| Stock B | -2.8% | -10.1% |
| Nifty | 7.3% |
As can been seen from the above table, if the returns on the stock is more than Nifty returns, then the output is positive. If the stock’s returns is lower than the Nifty returns the output is negative.
Price momentum is the rate of change in price of a particular stock. Momentum investing is a strategy that tries to understand the existing trend in the market and attempts to capitalize on the same. So if a momentum investor feels that the bull run in the market will continue he/she will buy stocks which have outperformed the index. If he/she feels that the market is about to enter bear phase, then it makes sense to sell stocks that have under performed the index.
Percentage from 52W High
The percentage difference between the 52 week high price of the stock and its closing price
Suppose the 52 week high price of the stock is Rs.120 and the current close price is Rs.90, the output is calculated as (120 / 90) -1 = 33.3%. For example, a value of 3% would mean that the 52W high is 3% away from the current stock price
Percentage from 52W Low
The percentage difference between the close price of the stock and its 52 week low price
Suppose the 52 week low price of the stock is Rs.120 and the current close price is Rs.190, the output is calculated as (190 / 120) -1 = 58.3%. In this case, an output of 3% would mean that the stock is 3% above the 52W low price
PE Ratio
PE ratio is calculated as close price of the stock divided by the earnings per share excluding extraordinary items for the most recent financial year. The ratio indicates the number of units of stock price it takes to purchase a single unit of the company’s earnings per share (EPS). If the company is currently trading at Rs.300/share and EPS of the company is Rs.30, then the PE ratio is 300/30 = 10x. So it costs Rs.10 to be eligible to purchase Re.1 of the company’s earnings
PE ratio is the most important valuation ratio and helps understand whether a company is undervalued or overvalued. The best way to use a PE ratio is by comparing the ratio of different companies operating in the same sector
Suppose company A is trading at a PE ratio of 12 and B is trading at a PE of 17. Obviously A is undervalued when compared to B as it costs only Rs.12 to purchase 1 units of A’s EPS, whereas B’s costs Rs.17. However it is important to understand the reason behind the undervaluation. If the market is expecting B to grow at a faster rate, demand for shares of B will increase leading to higher share price and consequently higher PE ratio. So in this case the higher PE for B is justified. However suppose market has not correctly understood A’s earning potential and hence has ignored the stock leading to low PE. Such a situation might present a genuine buying opportunity of the stock, however it is important to ensure that the market has not correctly understood A’s earning potential. If market has ignored A because of poor earnings or bad management practice, it is better to ignore the same in spite of relative cheapness
Forward PE Ratio
Forward PE ratio is calculated as close price of the stock divided by estimated earnings per share of the company for the current financial year. If the current stock price is Rs.300 and estimated EPS of the company for the current financial year is Rs.8, then forward PE ratio is 300/8 = 37.5
Forward PE ratio can be used to compare it with the current PE ratio of the company. Suppose current PE ratio of company A is 15 and the forward PE ratio is 12, it indicates that EPS of the company is expected to grow over the next year. The deeper the discount between current PE ratio and the forward PE ratio, the higher the potential for the stock price to increase
PE Premium vs Sector
This data item is calculated as the percentage difference between the stock PE ratio and the sector PE ratio
| PE ratio | Premium / Discount | |
|---|---|---|
| Stock A | 22.0 | 25.0% |
| Stock B | 12.3 | -30.1% |
| Sector average | 17.6 | -- |
As can be seen from the table above, stock A has a higher PE ratio than the sector average which results in a positive output. When the output is positive it is said that the stock is trading at a premium to the sector. In stock B’s case the output is negative, indicating that the stock’s PE ratio is lower than the sector’s PE ratio. In such a scenario it is said that stock is trading at a discount to the sector.
A company might be trading at discount to the sector either because the stock’s future earnings potential are low or because market has not noticed its earnings potential and hence there is a temporary pricing mismatch.
Such a situation might present a genuine buying opportunity of the stock, however it is important to ensure that the market has not correctly understood B’s earning potential. If market has ignored B because of poor earnings or bad management practice, it is better to ignore the same in spite of relative cheapness.
PB Ratio
This ratio is calculated as recent close price of the stock divided by book value per share of the company for the most recent financial year. Book value per share refers to the total shareholders investment in the company divided by shares outstanding
The ratio helps understand the unit price to be paid for the assets leftover after paying all liabilities of the company. Suppose the company has total assets of Rs.250. These assets have been purchased using Rs.180 of debt and Rs.70 shareholders equity. Hence if all liabilities of the company are to be paid off, Rs.180 worth of assets will have to be sold and Rs.70 will remain on the books of the company. If the share price of the company is Rs.300, PB ratio will be calculated as 300 / 70 = 4.3x
Just as in PE ratio, PB ratio is used for valuation purposes, specially in case of banks and financial companies. Non banking companies do carry large amount of assets on their books, however these assets are not valued on a regular basis, hence there is usually a huge divergence between book value and market value of the assets. On the contrary banks and financial companies regularly value the assets they carry on their books. Hence using PB ratio to value such companies is more appropriate and relevant
A low PB stock is considered to be undervalued compared to a higher PB one. However it is important to further analyse the reasons behind undervaluation before deciding to buy the stock
PB Premium vs Sector
This data item is calculated as the percentage difference between the stock PB ratio and the sector PB ratio
| PB ratio | Premium / Discount | |
|---|---|---|
| Stock A | 3.8 | 40.7% |
| Stock B | 1.3 | -51.9% |
| Sector average | 2.7 | -- |
As can be seen from the table above, stock A has a higher PB ratio than the sector average which results in a positive output. When the output is positive it is said that the stock is trading at a premium to the sector. In stock B’s case the output is negative, indicating that the stock’s PB ratio is lower than the sector’s PB ratio. In such a scenario it is said that stock is trading at a discount to the sector
A company’s PB ratio might be at a discount to the sector because the earnings potential of the company is considered to be low or the assets of the company are under stress. It is also possible that PB is at a discount as the market has mispriced the stock. Prudent analysis is necessary before making a purchase decision.
Dividend Yield
The ratio is calculated as dividend per share (DPS) for the most recent financial year divided by the close price of the stock. Dividend is the portion of company’s profit that is paid out to shareholders. Dividend per share (DPS) refers to the total dividend paid out divided by the common stock of the company
Suppose DPS is Rs.16 and stock price is Rs.250, dividend yield is calculated as (16/250)*100 = 6.4%
The ratio is used to calculate the earning on investment considering only dividends declared. Higher the dividend yield the better. One should always consider dividend yield when investing in a company’s stock, as it can be significant part of the return that might be generated. High dividend yield stocks could be a good investment avenue to supplement any income needs
Dividend Yield vs Sector
The data item is defined as the difference between the dividend yield of company and the yield of the corresponding sector. A positive number indicates that the dividend yield of the company is higher than average payout of the sector and vice versa
It is important to note that lot of fast growing companies do not pay dividends and prefer to retain money for future investment purposes. Alternatively a company might also not be paying dividends because of poor profitability. So one has to investigate the company to understand the reason behind deep discount or high premium
PS Ratio
The item is defined as close price of the stock divided by the revenue per share of the company for the most recent financial year. The ratio indicates the number of number of units of stock price to be expended to purchase 1 unit of revenue per share. Suppose revenue of the company is Rs.100,000, shares outstanding is 500 and stock price is Rs.100. PS ratio is calculated as 100/ (100,000/500) = 0.5x. So it costs Rs. 0.5 to purchase every Rupee of the company’s revenue
PS ratio is a valuation ratio and is used in lieu of PE ratio. When a company is loss making, EPS becomes negative and calculating PE ratio is not possible. In such a scenario PS ratio can be used. Just as in PE ratio, PS ratio is used by comparing the ratio of 2 or more companies operating in the same sector. The lower the ratio, the more undervalued the company. However one has to understand the reasons behind undervaluation before deciding whether the stock has investment potential
Forward PS Ratio
Forward PS ratio is calculated as close price of the stock divided by estimated revenue per share of the company for the current financial year. If the current stock price is Rs.300 and estimated revenue per share of the company for the current financial year is Rs.80, then forward PS ratio is 300/80 = 3.75
Forward PS ratio can be used by comparing it with the current PS ratio of the company. Suppose current PS ratio of company A is 3x and the forward PS ratio is 1.8x, it indicates that the revenue of the company is expected to grow over the next year. The deeper the discount between current PS ratio and the forward PS ratio, the higher the potential for the stock price to increase
PS Premium vs Sector
This data item is calculated as the percentage difference between the stock PS ratio and the sector PS ratio
| PS ratio | Premium / Discount | |
|---|---|---|
| Stock A | 4.7 | 51.6% |
| Stock B | 1.9 | -38.7% |
| Sector average | 3.1 | -- |
As can be seen from the table above, stock A has a higher PS ratio than the sector average which results in a positive output. When the output is positive it is said that the stock is trading at a premium to the sector. In stock B’s case the output is negative, indicating that the stock’s PS ratio is lower than the sector’s PS ratio. In such a scenario it is said that stock is trading at a discount to the sector
A company’s PS ratio might be at a discount to the sector because the growth potential of the company is considered to be low or the business of the company is under stress. It is also possible that PS is at a discount as the market has mispriced the stock. Prudent analysis is necessary before making a stock purchase decision.
1Y Forward Revenue Growth
Revenue is the amount of money that a company receives in lieu of goods sold or services rendered
The data item is calculated as the percentage change between estimated revenue for the current financial year and actual revenue for the most recently reported financial year
The data items gives an idea about the expected growth in revenue during the current financial year. It is important to note that estimate of revenue for the current financial year will change, during the year, depending on analysts estimate of the same
High revenue growth indicates that the goods or service offered by the company is found acceptable by the market and that the company is able to successfully expand its business. Over the medium term only high revenue growth will lead to greater profitability and hence a company should always seek to expand its business. Higher the expected revenue growth, the better
1Y Historical Revenue Growth
The data item is calculated as the percentage change between actual revenue for the most recent reported financial year and the revenue for the financial year before that. The data item allows to understand the actual growth rate of revenue during a particular financial year
5Y Historical Revenue Growth
The data item is calculated as the compounded annual growth rate (CAGR) of revenue over the previous 5 financial years. Compounded annual growth rate is the average annual growth rate of an item over a specified period of time longer than one year. Consider the growth rates of sales for a few years in the below table:
| FY2010 | FY2011 | FY2012 | FY2013 | FY2014 | FY2015 | |
|---|---|---|---|---|---|---|
| Actual sales | 700.0 | 920.0 | 850.0 | 910.0 | 1020.0 | 960.0 |
| Yearly growth rate | 31.4% | -7.6% | 7.1% | 12.1% | -5.9% | |
| CAGR | 6.5% |
While it is obvious that between FY2010 and FY2015 the sales of the company increased, the increase and decrease in the interim years does not allow us to understand the approximate yearly growth rate. In such a scenario using compounded annual growth rate is very helpful. CAGR number in the above table has been calculated using the below formula:
((Sales in FY2015 / Sales in FY2010) ^ ( 1/N)) -1, where N is the number of years of growth rate i.e 5
Higher the historical revenue growth rate, the better
1Y Forward EBITDA Growth
Earnings before interest taxes and depreciation (EBITDA) measures the company’s operating performance. It is calculated as revenue minus operating costs excluding depreciation and amortisation costs. The data item is calculated as the percentage change between estimated EBITDA for the current financial year and actual EBITDA for the most recently reported financial year. As the data item is based on analysts estimate of EBITDA for the current financial year, the growth estimate, during the year, will change depending on the analyst’s outlook of EBITDA
When expanding its business, a company should also seek to expand its operating profitability. If the revenue of the company grows at a fast pace without commensurate growth in EBITDA, EBITDA margin will fall leading to lowered net profit margin as well
Suppose in year 1, the revenue of the company was Rs.100 and EBITDA was Rs.30. EBITDA margin during the year would be (30/100) 30%. In year 2, revenue of the company grows by 10% to Rs.110, whereas EBITDA grows only by 5% to Rs.31.5. EBITDA margin during the year is now 28.6%. However if the EBITDA had also increased by 10% to Rs.33, EBITDA margin would have been (33/110) 33%. It is important to seek out companies whose EBITDA growth is at least the same as its revenue growth rate, if not more
1Y Historical EBITDA Growth
The data item is calculated as the percentage change between actual EBITDA for the most recent reported financial year and the EBITDA for the financial year before that. The data item allows to understand the actual growth rate of EBITDA during a particular financial year
5Y Historical EBITDA Growth
The data item is calculated as the compounded annual growth rate (CAGR) of EBITDA over the previous 5 financial years. Compounded annual growth rate is the average annual growth rate of an item over a specified period of time longer than one year. Consider the growth rates of EBITDA for a few years in the below table:
| FY2010 | FY2011 | FY2012 | FY2013 | FY2014 | FY2015 | |
|---|---|---|---|---|---|---|
| Actual EBITDA | 70.0 | 92.0 | 85.0 | 91.0 | 102.0 | 96.0 |
| Yearly growth rate | 31.4% | -7.6% | 7.1% | 12.1% | -5.9% | |
| CAGR | 6.5% |
While it is obvious that between FY2010 and FY2015 the EBITDA of the company increased, the increase and decrease in the interim years does not allow us to understand the approximate yearly growth rate. In such a scenario using compounded annual growth rate is very helpful. CAGR number in the above table has been calculated using the below formula:
((EBITDA in FY2015 / EBITDA in FY2010) ^ ( 1/N)) -1, where N is the number of years of growth rate i.e 5
Higher the historical EBITDA growth rate, the better
1Y Forward EPS Growth
Earnings per share (EPS) is calculated as net profit divided by the common shares outstanding. EPS is a portion of the company’s profit that is allocated to each outstanding share of common stock
The data item is calculated as the percentage change between estimated EPS for the current financial year and actual EPS for the most recently reported financial year
EPS growth indicates the growth rate of the company’s profit, per unit of equity. Theoretically, a company might be able to expand its operations and increase its profits by issuing more shares and investing the same into business. However because of increase in the number of shares, EPS will not grow. A company that is able to grow its profit, per unit of equity, is considered to be efficient
1Y Historical EPS Growth
The data item is calculated as the percentage change between actual EPS for the most recent reported financial year and the EPS for the financial year before that. The data item allows to understand the actual growth rate of EPS during a particular financial year
5Y Historical EPS Growth
The data item is calculated as the compounded annual growth rate (CAGR) of EPS over the previous 5 financial years. Compounded annual growth rate is the average annual growth rate of an item over a specified period of time longer than one year. Consider the growth rates of EPS for a few years in the below table:
| FY2010 | FY2011 | FY2012 | FY2013 | FY2014 | FY2015 | |
|---|---|---|---|---|---|---|
| Actual EPS | 7.0 | 9.2 | 8.5 | 9.1 | 10.2 | 9.6 |
| Yearly growth rate | 31.4% | -7.6% | 7.1% | 12.1% | -5.9% | |
| CAGR | 6.5% |
While it is obvious that between FY2010 and FY2015 the EPS of the company increased, the increase and decrease in the interim years does not allow us to understand the approximate yearly growth rate. In such a scenario using compounded annual growth rate is very helpful. CAGR number in the above table has been calculated using the below formula:
((EPS in FY2015 / EPS in FY2010) ^ ( 1/N)) -1, where N is the number of years of growth rate i.e 5
Higher the historical EPS growth rate, the better
1Y Forward Operating Cash Flow Growth
Cash flow from operating activities (CFO) indicates the amount of money that a company is able to generate via its normal business operations. This does not include investment income like dividend or interest income or money inflow via debt raised or equity issued. A company that can consistently generate positive cash flows from its daily business operations is highly valued by investors
The data item is calculated as the percentage change between estimated operating cash flow for the current financial year and actual operating cash flow for the most recently reported financial year
1Y Historical Operating Cash Flow Growth
The data item is calculated as the percentage change between actual CFO for the most recent reported financial year and the CFO for the financial year before that. This data item allows to understand the growth rate of CFO during a particular financial year
5Y Historical Operating Cash Flow Growth
The data item is calculated as the compounded annual growth rate (CAGR) of CFO over the previous 5 financial years. Compounded annual growth rate is the average annual growth rate of an item over a specified period of time longer than one year. Consider the growth rates of operating cash flow for a few years in the below table:
| FY2010 | FY2011 | FY2012 | FY2013 | FY2014 | FY2015 | |
|---|---|---|---|---|---|---|
| Actual operating cash flow | 40.0 | 52.0 | 47.3 | 57.8 | 62.3 | 57.4 |
| Yearly growth rate | 30.0% | -9.0% | 22.2% | 7.8% | -7.9% | |
| CAGR | 7.5% |
While it is obvious that between FY2010 and FY2015 the operating cash flow of the company increased, the increase and decrease in the interim years does not allow us to understand the approximate yearly growth rate. In such a scenario using compounded annual growth rate is very helpful. CAGR number in the above table has been calculated using the below formula:
((Operating cash flow in FY2015 / Operating cash flow in FY2010) ^ ( 1/N)) -1, where N is the number of years of growth rate i.e 5
Higher the historical operating cash flow growth rate, the better
3Y Historical Dividend Growth
Dividend is the portion of company’s profit that is paid out to shareholders. Dividend per share (DPS) refers to the total dividend paid out divided by the common stock of the company. DPS allows investors to earn back a portion of their investment and is an important aspect of stocks returns
The data item is calculated as the compounded annual growth rate (CAGR) of DPS over the previous 3 financial years. Compounded annual growth rate is the average annual growth rate of an item over a specified period of time longer than one year. Consider the growth rates of DPS for a few years in the below table:
| FY2010 | FY2011 | FY2012 | FY2013 | |
|---|---|---|---|---|
| DPS | 7.0 | 9.2 | 8.5 | 9.1 |
| Yearly growth rate | 31.4% | -7.6% | 7.1% | |
| CAGR | 9.1% |
While it is obvious that between FY2010 and FY2013 the DPS of the company increased, the increase and decrease in the interim years does not allow us to understand the approximate yearly growth rate. In such a scenario using compounded annual growth rate is very helpful. CAGR number in the above table has been calculated using the below formula:
((DPS in FY2013 / DPS in FY2010) ^ ( 1/N)) -1, where N is the number of years of growth rate i.e 3
Higher the historical DPS growth rate, the better
Long Term Debt to Equity
Long term (LT) Debt to Equity ratio is calculated as the ratio of LT debt of the company to the shareholders equity of the company for the most recent financial year. Long term debt refers to the loan amount raised by the company, which is repayable at least only after 1 year. Shareholders equity is the sum of profits retained by the company and amount invested into the company by shareholders
This ratio helps understand the extent to which the company is raising loans to fund projects. Suppose the LT debt of the company is Rs.130 and shareholders equity is Rs.100. Then LT debt equity ratio is 130/100 = 1.3
Interest expense is a fixed cost that has to be paid on loan / debt raised by the company. Higher the debt raised more the interest cost. So if the company funds projects using more of debt funds, interest expense automatically increases eating into profitability of the company. Hence, all other things remaining the same, company with lower long term debt to equity ratio is preferable compared to ones with higher ratio
A company with decreasing trend in LT debt to equity ratio over the medium term will usually see improved profits and record higher ROE. LT debt to equity ratio of companies operating in the same sector can also be compared with each other
Debt to Equity
Debt to Equity ratio is calculated as the total outstanding debt of the company divided by the shareholders equity of the company for the most recent financial year. To understand it better, please read about long term debt to equity ratio above. Total debt is the sum of all kinds of loan amount raised by the company regardless of repayment schedule
This ratio helps understand the extent to which debt capital is used to fund projects as well as to meet day to day working expenses of the company. Higher the debt capital, higher the interest cost leading to lower profits. Hence companies with lower debt to equity ratio are more preferable. Debt to equity ratio of companies operating in the same sector can be compared with each other
Quick Ratio
Quick ratio is calculated as total current assets minus inventory for the most recent financial period divided by total current liabilities for the same period. Current assets include short term assets like cash, inventory and receivables whereas current liabilities includes obligations that are due within 1 year such as short term debt, accounts payable etc. Since inventory cannot always be sold off at short notice, it is not considered a liquid asset
Suppose total current assets of a company is Rs.250, inventory is Rs.50 and current liabilities is Rs.300, quick ratio can be calculated as (250 – 50) / 300 = 0.67. So the company has Rs.0.67 quick asset to meet every Rs.1 current liability
Quick ratio allows to understand how quickly a company can meet its short term financial obligations, by monetising liquid assets. Higher the quick ratio better the liquidity situation of the company. Quick ratio of 2 or more companies operating in the same sector can be compared with each other
Current Ratio
Current Ratio is calculated as total current assets divided by total current liabilities for the most recent financial period. Current assets include short term assets like cash, inventory and receivables whereas current liabilities includes obligations that are due within 1 year such as short term debt, accounts payable etc
Suppose total current assets of a company is Rs.250 and current liabilities is Rs.300, current ratio can be calculated as 250 / 300 = 0.83. So the company has Rs.0.83 current assets to meet every Rs.1 current liability
The ratio helps understand the company’s ability to pay off its short term liabilities using its current assets. It is important to understand that while current ratio of 1 is considered optimal, an extreme divergence on either sides from this point is not desirable. A very low ratio indicates that the company is having trouble collecting from its debtors or takes a long time to sell inventory whereas a very high ratio indicates that the company might be holding lot of cash without investing the same appropriately
Cash Conversion Cycle
Cash conversion cycle is calculated as the sum of average inventory days and average receivables collection days minus average payables payment period for the financial year. The ratio, expressed in number of days, helps understand the length of time it takes to convert raw material into inventory, sell the inventory, collect cash from debtors and pay off creditors who supplied raw materials
For example if the company takes 28 days to manufacture the product and sell it on credit, 13 days to collect from debt holders and has 32 days time to pay of its creditors – cash conversion cycle is 28+13-32 i.e 9 days
Cash conversion cycle indicates how efficiently the company is using short-term assets and liabilities to generate cash. The lower the number of days, the more efficient the company is in converting raw material into finished products, selling the same and collecting cash
Interest Coverage Ratio
This ratio is calculated as earnings before interest and taxes (EBIT) for the most recent financial year divided by the interest expense for the same period. Earnings before interest and taxes is calculated as sales minus operating expense – which includes cost of goods sold, selling and general expenses etc. Interest expense is paid out on the outstanding debt amount of the company, higher the debt higher the interest pay out
Suppose EBIT of the company is Rs.120 and interest expense is Rs.50, interest coverage ratio is 2.4, indicating that the company has Rs.2.4 for every Re.1 of interest payment
This ratio helps understand whether the company can pay off its interest obligations in a timely manner. If the ratio is less than 1, it indicates that the company’s operating profit is not sufficient to make interest payments and that the financial health of the company is in dire straits. A number equal to 1 means all operating profits will be expended towards make interest payments and net profit will be zero. Higher the coverage ratio above 1 better the financial health of the company
Return on Equity
Return on equity (ROE) is defined as net profit divided by the average common equity for the most recent financial year. The ratio helps understand number of units of profit generated per unit of money invested in the company. Higher the ROE better the utilisation of shareholders money
Common equity refers to the money invested in the company by common shareholders. It is important to ensure that money invested during the financial year does not distort the ROE number. Hence average common equity, i.e average of common equity at the beginning and end of the financial year is considered for calculation
The current year ROE number needs to be compared with the historical ROE numbers of the company to understand whether it is efficiently utilising capital. If the ROE numbers are trending up, it is a positive sign
ROE numbers of different companies operating in the same sector can also be compared with each other
5Y Avg Return on Equity
5Y Avg Return on Equity is the average of the annual ROE number over the previous 5 financial years
As discussed above, ROE helps understand number of units of profit generated per unit of money invested in the company. Higher the number better the utilisation of equity capital
When analysing 2 or more companies, comparing ROE numbers for a single year will not suffice. It is possible that profits have increased or decreased substantially due to extraordinary profits or losses in a particular year, thereby falsifying the picture. Suppose we are comparing 5 years of data for 3 companies, we will have to inspect 15 (3*5) data points which can be cumbersome
Instead, using average ROE is more simpler as well as eliminates the possibility of data distortion due to one-off earnings or losses
Return on Assets
Return on assets (ROA) is defined as net profit divided by the average total assets for the most recent financial year. The ratio helps understand number of units of profit generated per unit of assets owned by the company. Higher number indicates better asset utilisation. In order to ensure assets bought during the financial year does not distort the ROA number, average of assets at the beginning and ending of the financial year is used
An increasing trend in ROA indicates improved efficiency in managing the assets of the company. ROA’s of 2 or more companies operating in the same sector can also be compared with each other
5Y Avg Return on Assets
5Y Avg Return on Assets is the average of the annual ROA number over the previous 5 financial years. ROA helps understand number of units of profit generated per unit of assets owned by the company, higher the number better the asset utilisation
Averaging historical ROA numbers reduces the number of data points that needs to be studied, as well as smooths the series of numbers and eliminates any distortion due to one off profit or loss
Daily volume
Volume refers to the total number of shares of particular company traded in the stock market on a given day.
Usually multiple transactions in the scrips of a company take place every day. Every transaction has a buyer and a seller. Shares that are agreed to be exchanged during each such transaction is added to the total volume count once.
| Buyer | Seller | No. of shares traded |
|---|---|---|
| A | Q | 100 |
| C | R | 3600 |
| X | D | 178 |
| Total volume | 3878 |
1 month average daily volume
This is the simple average of daily trading volume of a security going back over the previous 1 month. If the average volume of security is high it shows that lot of people are willing to trade in the security and trades in the security can be easily executed.
| Company name | 1 month average daily trading volume |
|---|---|
| A | 10,00,000 |
| B | 3,000 |
In the above example in case of company A, on an average 10 lakh shares of the company are being bought and sold on daily basis over the previous 1 month. So if a person is looking to buy 1000 shares the order will be easily executed. However in case of company B, the 1 month average trading volume is just 3000 and an order to trade 1000 shares is approximately 33% of all orders on any given day. If the trader is looking to buy, share prices of company B will start trending up because of the huge volume in flow. Similarly share prices will tank if B is looking to sell large number of shares at single go in an illiquid stock.
3 month average daily volume
This is the simple average of daily trading volume of a security going back over the previous 3 months. If the average volume of security is high it shows that lot of people are willing to trade in the security and trades in the security can be easily executed.
| Company name | 3 month average daily trading volume |
|---|---|
| A | 8,00,000 |
| B | 4,500 |
In the above example in case of company A, on an average 8 lakh shares of the company are being bought and sold on daily basis over the previous 3 months. So if a person is looking to buy 1000 shares the order will be easily executed. However in case of company B, the 3 months average trading volume is just 4,500 shares and an order to trade 1000 shares is approximately 22% of all orders on any given day. If the trader is looking to buy, share prices of company B will start trending up because of the huge volume in flow. Similarly share prices will tank if B is looking to sell large number of shares at single go in an illiquid stock.
1 day percentage change in volume
This is the percentage change in trading volume between 2 consecutive trading days. If the current day trading volume is 85 and the previous day trading volume is 72, 1 day percentage change in volume is calculated as (85/72) – 1 = 18.05%.
1 week percentage change in volume
This is the percentage change in trading volume over the previous 1 week. If the current day trading volume is 79 and the trading volume 1 week ago was 89, 1 week percentage change in volume is calculated as (79/89) – 1 = -11.23%.
EV / EBITDA
EV / EBITDA stands for Enterprise value (EV) divided by Earnings before interest, taxes and depreciation (EBITDA).
EV is a measure of the company’s total value and can be considered as the sum of money that needs to paid to all the stakeholders by the acquirer if he/she intends to buy the company today.
EBITDA is a measure of the company’s operating performance. It indicates the amount of profit the company earned via its core business operations before paying interest expense, taxes etc.
Suppose EV of a company is Rs.10,000 and EBITDA for the previous financial year was Rs.2,500. EV/EBITDA of the company is 10,000 / 2,500 = 4.0x.
EV/EBITDA is a valuation ratio and helps understand whether the company is overvalued or undervalued. The best way to use a EV/EBITDA ratio is by comparing the ratio of different companies operating in the same sector. A company with lower EV/EBITDA is considered to be undervalued in comparison with company with higher EV/EBITDA. However it is important to understand the reason behind the undervaluation. Suppose company A has EV/EBITDA of 4.0x whereas company B has EV/EBITDA of 6.3x. If the market is expecting B to grow at a faster rate, higher valuation for the same is justified. However suppose market has not understood company A’s potential correctly, then the lower valuation multiple is justified and presents a buying opportunity of the stock. If market has ignored A because of poor earnings or bad management practice, it is better to ignore the same in spite of relative cheapness.
Net Profit Margin
Net Profit Margin is defined as net profit divided by the revenue of the company for the most recent reported financial year. The ratio explains number of units of profit earned for every 100 units of revenue. For example if the net profit margin is 12%, it means that for every Rs.100 revenue, Rs.12 was converted into profit. Obviously higher the net profit margin the better
For the purpose of analysis, one should compare the current year net profit with historical numbers to understand whether the company is operating efficiently. Net profit margin of 2 or more companies, operating in the same sector, can also be compared with each other to select the more profitable one
5Y Avg Net Profit Margin
5Y Avg Net Profit Margin is the average of the net profit margin number over the previous 5 financial years. As discussed above, net profit margin explains number of units of profit earned for every 100 units of revenue
Averaging historical numbers smoothes any distortions in net profit margin due to one off expense or income. It also allows easier comparison of number of years of data points for multiple companies
Return on Investment
Return on Investment (ROI) is defined as net income divided by the average of shareholders equity, long term debt and other long term liabilities for the most recent financial year. Average of shareholders equity, long term debt and other long term liabilities is calculated by considering the average of the aforementioned items at the beginning and ending of the financial year. ROI is an efficiency indicator that helps understand the number of units of income earned for every Rs.100 investment
For example, let’s assume the operating income of a company is Rs.30, long term debt is Rs.25 and shareholders equity is Rs.150. The total capital is the sum of long term debt and shareholders equity, hence 25+150 = Rs.175. ROI will be calculated as 30 / 175 = 17.1%. This indicates that the company earned Rs.17.1 for every Rs.100 investment
A company’s current ROI can be compared with its historical returns’, ROI of companies operating in the same sector can also be compared with each other
5Y Avg Return on Investment
5Y Avg Return on Investment is the average of ROI for the most recent 5 financial years. As explained above, ROI is an efficiency indicator that helps understand the number of units of income earned for every Rs.100 investment
Operating Profit Margin
Operating Profit Margin is defined as operating profit divided by the revenue of the company for the most recent reported financial year. Operating profit indicates the amount of revenue left over after paying for operating costs of the company like cost of goods sold, salaries, selling and distribution expenses etc
The ratio indicates the number of units of operating profit earned for every 100 units of revenue. For example if the operating profit margin is 21%, it means that for every Rs.100 revenue, Rs.21 was converted into operating profit. The ratio allows us to understand how strong the operations of the company are and how much money is leftover to pay interest costs. Obviously higher the operating profit margin the better
For the purpose of analysis, one should compare the current year operating profit with historical numbers to understand whether the company continues to operate efficiently. Operating profit margin of 2 or more companies, functioning in the same sector, can also be compared with each other to select the more efficient one
5Y Avg Operating Profit Margin
Average operating profit margin – 5 year is the average of the operating profit margin over the previous 5 financial years
Operating profit margin helps understand the number of units of operating profit earned for every Rs.100 revenue
Averaging historical numbers smoothes any distortions in operating profit margin due to sudden spike or drop in operating costs of the company. It also facilitates easy comparison of number of years of data for multiple companies
Percentage From Upper Bollinger Band
Bollinger band consists of 3 lines. The middle line is calculated as 20 day moving average of price close numbers, refer to column 2 in the below table. The upper and lower bands are set at 2 standard deviations from the middle line, refer to columns 4 and 5. The last column is calculated as the difference between upper and lower band and indicates volatility. If volatility is high, the band in the last column will widen and will narrow down when volatility is low.
| Day | Middle band - 20 day SMA (A) | 20 day standard deviation (B) | Upper band (C) = [(A) + 2*(B)] | Lower band (D) = [(A) - 2*(B)] | Band width (E) = (C) - (D) |
|---|---|---|---|---|---|
| 1 | 88.71 | 1.29 | 91.29 | 86.12 | 5.17 |
| 2 | 89.05 | 1.45 | 91.95 | 86.14 | 5.81 |
| 3 | 89.24 | 1.69 | 92.61 | 85.87 | 6.75 |
| 4 | 91.80 | 1.77 | 92.93 | 85.85 | 7.09 |
| 5 | 92.66 | 1.90 | 93.31 | 85.70 | 7.61 |
The upper and lower band acts as resistance and support lines. This allows the trader to anticipate the price action of the stock. Generally Bollinger bands contain 80-90% of the price action, which makes a move outside the bands significant. Prices above the upper Bollinger bands are considered relatively high. The filter value is calculated by dividing the close price by upper Bollinger band and subtracting one – indicating how far the close price is from upper Bollinger band in percentage terms. Thus, a high positive value of the filter might indicate relatively higher price. Bollinger bands should always be used in tandem with other technical indicators, as in a strong uptrend prices can remain close to or above the upper Bollinger band for a long period of time.
Percentage From Lower Bollinger band
As explained above, Bollinger band consists of 3 lines – upper, lower and middle line. The filter value is calculated by dividing the close price by lower Bollinger band and subtracting one – indicating how far the close price is from lower Bollinger band in percentage terms. Thus, a high negative value of the filter might indicate relatively lower price. Bollinger bands should always be used in tandem with other technical indicators, as in a strong downtrend prices can remain close to or below the lower Bollinger band for a long period of time.
Percentage From Parabolic SAR
Parabolic SAR is used to determine the direction of a security’s momentum and the point at which this momentum might switch direction. Calculation of the item is complex and beyond the scope of this discussion.
When the SAR is below the stock price it indicates bullish uptrend in price action and is also considered the support level for the stock. When the stock price falls below the SAR it leads to bearish trend in prices and the SAR acts as a resistance level. This filter is calculated by dividing the close price by the parabolic SAR and subtracting one to calculate how far is the close price from SAR in percentage terms. A high positive value of the indicator signals strong uptrend and vice versa.
William %R
William %R uses a 14 day look back period and compares the close price of the stock with it’s high – low range to understand whether the stock is in oversold or overbought range. It is calculated using the formula:
%R = (Highest High – Close) / (Highest High – Lowest Low) * -100
Lowest Low = lowest low for the look-back period
Highest High = highest high for the look-back period
Close = close price of the security for the day
William %R values range from 0 to -100. -50 is the center point and it is important to watch out for movement above and below this level. A crossover above -50 indicates that the price of the stock is trading in the upper half of the high – low range for the 14 day period. Conversely a move below -50 indicates that prices are trading in the bottom half of the given lookback period.
A reading between 0 to -20 shows overbought market conditions. Readings between -80 to -100 indicates oversold market conditions.
Stochastic %K and %D
Just like William %R, Stochastic %K and %D indicates the momentum of a stock. It uses the current close price of the stock and it’s high – low range to understand whether a stock is in overbought / oversold range. The indicator is based on the assumption that in an upward trending market, prices will close near the day’s high and in downward trending market, prices will close near the day’s low.
Stochastic %K is calculated using the formula:
(Current Close – Lowest Low)/(Highest High – Lowest Low) * 100
It uses a 14 day lookback period. Stochastic %D is the 3 days simple moving average of %K. The %D number acts as a signal or trigger point.
Both %K and %D values range between 0 and 100. Buying and selling signals are generated when %K and %D come close to each other. When %K point moves above %D point, buy signal is generated. A sell signal is generated when %K crosses below %D.
Values of %D line that are above 80 indicates that the security is overbought and values below 20 indicates that it is oversold.
1W Change in On Balance Volume
Just like William %R and Stochastic indicators, On Balance Volume (OBV) is a momentum indicator that uses volume to forecast changes in stock price. OBV is based on the premise that sharp volume increase without corresponding change in stock price will eventually lead to price jump and vice versa.
OBV is a running total of positive and negative volume of a security. A period’s volume is positive when the current price close is above previous price close of the security. A period’s volume is negative when the current close is below the security’s previous close.
| Day | Price close | (A) : Up / Down (Mark 1 if current price close is higher than previous close else -1) | (B) : Volume | Positive / Negative (A) * (B) | OBV |
|---|---|---|---|---|---|
| 1 | 7661.6 | ||||
| 2 | 7578.8 | -1 | 385730 | -385730 | -385730 |
| 3 | 7457.4 | -1 | 676390 | -676390 | -1062120 |
| 4 | 7608.5 | 1 | 328598 | 328598 | -733522 |
| 5 | 7701.2 | 1 | 488766 | 488766 | -244756 |
| 6 | 7582.5 | -1 | 321296 | -321296 | -566052 |
| 7 | 7598.8 | 1 | 332924 | 332924 | -233128 |
OBV moves up when volume on price up days outpaces volumes on price down days. OBV falls when volume on price down days outpaces volume on price up days. In the above table, the cumulative volume on down days is 13,83,416 whereas on up days the cumulative volume is 11,50,288, hence the OBV number is negative.
Percentage change in OBV volume is calculated as the percentage difference in OBV over a 1 week period. So if the current OBV number is 100 and the OBV 1 week ago was 85, percentage change in OBV is (100/85) – 1 = 17.64%.
A positive percentage change in OBV accompanied by positive price change is a signal of strong upward price momentum. But a positive percentage change in OBV accompanied by a flat or small downward moving price signals that a price reversal might be coming.
Similarly, a negative percentage change in OBV accompanied with negative price change indicates strong downward momentum. But a negative percentage change in OBV accompanied by a flat or small upward price momentum signals that a price reversal might be coming.
1W Change in AD line
The Accumulation Distribution (A/D) line is used to measure the cumulative flow of funds into and out of a security. There are 3 parts to calculating the A/D line. First calculating the money flow multiplier using the price close, price high and price low numbers. Next money flow volume is calculated by multiplying volume for the period with money flow multiplier. Finally A/D line is calculated as the sum of previous A/D point and current money flow volume.
Percentage change in A/D point is calculated as the percentage difference in A/D points over a 1 week period. So if the current A/D number is 100 and the A/D number 1 week ago was 85, percentage change in A/D is (100/85) – 1 = 17.64%.
Uptrend in prices accompanied by negative percentage change in A/D line suggests underlying selling pressure and could be a precursor to a bearish trend in stock price. Conversely downtrend in prices accompanied by positive percentage change in A/D line indicates underlying buying pressure and could foreshadow a bullish reversal.
Super trend
Super trend is a trend following indicator and works well in trending markets, i.e in uptrends and downtrends. It does tend to give false signals when market moves sideways. Calculation of supertrend is complex and is beyond the scope of this discussion.
Super trend generates a buy signal when it closes above the security’s close price. A sell signal is generated when it closes below the security’s close price.