


Evaluating Mutual funds
All the ratios & metrics you need
Custom Filters
While the Screener comes with a host of in-built filters that you can use to shortlist funds, it also gives you the ability to create your own filters. The Custom Filter feature is available to all users.
A custom filter is a mutual fund filter that has been created by a user. Such a filter can be created by using one to five data items on Screener. Custom filters are useful because they allow you to dig deeper into the mutual fund universe and search for funds that match your specific criteria.
While the default filters are more than useful for most users to filter funds, savvier users can create custom filters to be able to carry out deeper research.
Let’s understand this with the example of VaR, which is a custom filter that you can create on Screener.
VaR or value at risk is a statistic used to measure the extent of possible losses within a portfolio over a period of time. At a 99% confidence interval, a 1 year VaR of 7.5% implies that the loss will be limited to 7.5%, 99% of the time over the horizon of 1 year. Losses that exceed 7.5% will only occur 1% of the time.
VaR (99% confidence level, 1 year) = Portfolio value * Zvalue * Standard deviation (1y)
Where Zvalue at 99% confidence interval is 2.326
Let’s assume we want to invest 2,00,000 in Fund A with an annual standard deviation of 15% and we want to know the max loss we will incur 99% of the time over a horizon of 1 year.
VaR,99%,1Y = 2,00,000 * 2.326 * 15%
= 69,780
This implies that losses will not exceed 69,780, 99% of the times in the 1 year horizon.
VaR is one custom filter that can be created on the Tickertape Screener by using just one data item : Standard deviation. There are many other data items that can be used to create other custom filters.
Creating a custom filter
To create a custom filter, you have to click on the ‘Add Filter’ button and then go to the ‘Custom’ option on the top.
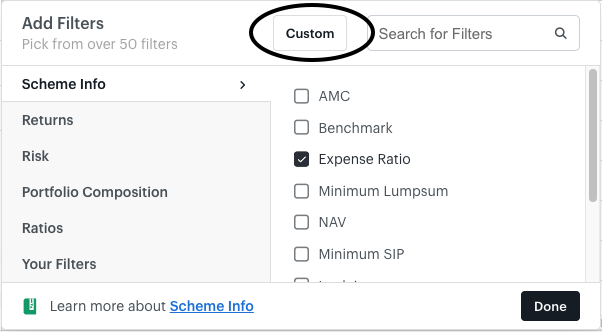
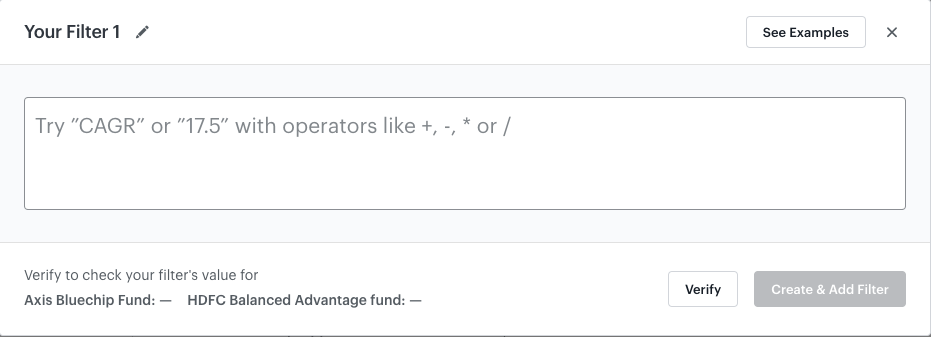
You can then type in the data items you need in your filter and create it. You can give the filter a name of your choice and verify it as well.
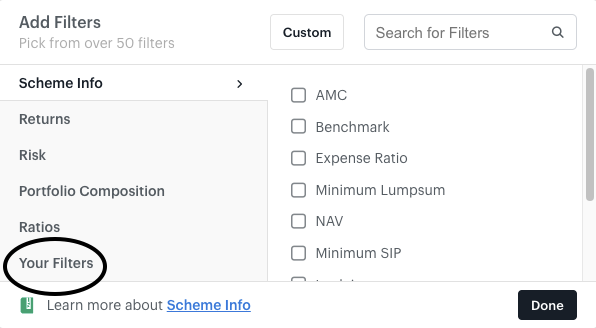
All of your custom filters appear under the ‘Your Filters’ tab.
This is how you can create and use custom filters on the Tickertape screener to build a portfolio of mutual funds that fits your needs and ideas.
Alpha
Alpha refers to the % outperformance by funds over and above the performance of their benchmark.
It is a measure of outperformance and thus higher alpha represents a better performance keeping other factors constant.
For eg : Fund A’s returns are 12.5% vs its benchmark’s returns of 10%, that makes Alpha = 12.5% – 10% = 2.5%
Similarly, Fund B belongs to the same category as fund A and has returns = 15% & thus an alpha of 5% representing outperformance over both its peer fund and its benchmark.
Absolute return 3M
Absolute return 3M represents the absolute growth in the funds NAV over a horizon of 3 months. As the name suggests, it is an absolute figure and is not annualized. It is a short term performance metric.
Absolute return 6M
Absolute return 6M represents the absolute growth in the funds NAV over a horizon of 6 months. As the name suggests, it is an absolute figure and is not annualized. It is a short term performance metric.
Absolute return 1Y
Absolute return 1Y represents the absolute growth in the funds NAV over a horizon of 12 months. For a return metric spanning over 12 months, the absolute figure equals the annualized figure.
Formula = (Ending NAV – beginning NAV)/ (Beginning NAV)
For eg : Following are the NAVs of fund A on different dates
31st March 2020 : 100
30th June 2020 : 105
30th September 2020 : 125
31st December 2020 : 135
31st March 2021 : 120
Returns as of 31st March 2021 would be :
Absolute return 3M = (120-135)/135 = – 11.11%
Absolute return 6M = (120-125)/125 = – 4%
Absolute return 1Y = (120-100)/100 = 20%
As we can see that time is not being used as a variable in the formula, that makes these returns absolute.
3Y average annual rolling return
Rolling returns, also known as “rolling period returns” or “rolling time periods,” are annualized average returns for a period, ending with the listed year. Rolling returns are more robust than trailing returns.
3Y rolling returns would involve going back 3 years and then calculating the past 3 year returns every day since then and then averaging those numbers.
Rolling returns in comparison to trailing returns are more likely to be an expected achievable return from the investment in the future.
CAGR 3Y
Compounded annual growth rate 3Y is an annualized return metric over a horizon of 3 years.
Formula = {(Ending NAV/Beginning NAV)^(1/3)} – 1
CAGR is the average growth over the horizon, the year wise returns might be erratic and uneven.
CAGR 5Y
Compounded annual growth rate 5Y is an annualized return metric over a horizon of 5 years.
Formula = {(Ending NAV/Beginning NAV)^(1/5)} – 1
CAGR is the average growth over the horizon, the year wise returns might be erratic and uneven.
CAGR 10Y
Compounded annual growth rate 10Y is an annualized return metric over a horizon of 10 years.
Formula = {(Ending NAV/Beginning NAV)^(1/10)} – 1
CAGR is the average growth over the horizon, the year wise returns might be erratic and uneven.
For eg : Following are the NAVs of fund A on different dates
31st March 2011 : 75
31st March 2016 : 150
31st March 2018 : 175
31st March 2021 : 225
Returns as of 31st March 2021 would be :
CAGR 3Y = {(225/175)^(1/3)}-1 = 8.74%
CAGR 5Y = {(225/150)^(1/5)}-1 = 8.45%
CAGR 10Y = {(225/75)^(1/10)}-1 = 11.61%
Sharpe
It represents the excess return earned for the extra volatility we endure for holding a riskier asset, in other words it is the excess returns earned per unit of risk ( risk being standard deviation )
Formula = return/ standard deviation.
The metric considers both risk and return and is better for evaluating funds as compared to considering risk & return individually. Higher the sharpe the better the risk adjusted performance.
Sortino
Like sharpe,Sortino also represents the excess return earned for the extra volatility we endure for holding a riskier asset, in other words it is the excess returns earned per unit of risk but here risk is defined as downside deviation instead of standard deviation.
The difference, Standard deviation considers both upside and downside deviation but the downside deviation ignores upside deviation. Sortino is considered superior to sharpe in the sense that investors are more concerned with downside risk instead of total risk.
Formula = return/ downside deviation.
The metric considers both risk and return and is better for evaluating funds as compared to considering risk & return individually. Higher the sortino better the risk adjusted performance.
P/E
In case of direct equity, P/E is just the ratio of price per share to earnings per share of the company in question. For MFs, P/E by default is a weighted average P/E of all the companies in its portfolio.
A fund with high P/E holdings will automatically have a higher P/E. Fund level P/E helps us understand if the fund is holding overvalued stocks or not.
Category P/E
Category P/E is simply the average P/E of all the funds in a given category.
For eg : There are 5 funds in the small cap category with the following P/Es:
| Fund | P/E |
| A | 25 |
| B | 27.5 |
| C | 30 |
| D | 32.5 |
| E | 35 |
The category P/E in this case will be 30.
The category P/E alone might not add value but individual fund P/Es can be compared to their respective category P/Es to find undervalued funds with upside available.
Returns vs Sub-category returns : 10Y
This metric is used to measure under or outperformance of funds relative to their category average returns.
Formula : (10Y CAGR of the fund)/(10Y CAGR of the category average returns)
This metric is either at a premium i.e > 1 which represents that the fund has outperformed its category over the stated horizon or at a discount i.e <1 representing underperformance.
Returns vs Sub-category returns : 1Y
This metric is used to measure under or outperformance of funds relative to their category average returns.
Formula : (1Y CAGR of the fund)/(1Y CAGR of the category average returns)
This metric is either at a premium i.e > 1 which represents that the fund has outperformed its category over the stated horizon or at a discount i.e <1 representing underperformance.
Returns vs Sub-category returns : 3Y
This metric is used to measure under or outperformance of funds relative to their category average returns.
Formula : (3Y CAGR of the fund)/(3Y CAGR of the category average returns)
This metric is either at a premium i.e > 1 which represents that the fund has outperformed its category over the stated horizon or at a discount i.e <1 representing underperformance.
Returns vs Sub-category returns : 5Y
This metric is used to measure under or outperformance of funds relative to their category average returns.
Formula : (5Y CAGR of the fund)/(5Y CAGR of the category average returns)
This metric is either at a premium i.e > 1 which represents that the fund has outperformed its category over the stated horizon or at a discount i.e <1 representing underperformance.
For eg:
3Y CAGR of fund A is 22% vs its category average 3Y CAGR of 20% then Returns vs Sub-category returns : 3Y = 22%/20% = 1.1 ( at a premium )
% away from ATH
This is the % difference between the current NAV of the fund and it’s all time high NAV. This metric can be used to track either the fund’s position relative to its own historical performance or vs other funds & its benchmark.
Calculation : Fund A’s All time high NAV is 150 and the current NAV is 120 then % away from ATH = (150-120)/150 = 20%
For eg ( vs benchmark ) : A mid cap fund is 15% away from its ATH vs its benchmark being 20% away from its ATH represents a lower drawdown or relative outperformance
For eg ( vs other funds ) : There are 5 mid cap funds with the following % away from ATH figures.
| Fund | % away from ATH |
| A | 10% |
| B | 7% |
| C | 12% |
| D | 9% |
| E | 15% |
Using the figures, we can see that fund B is the least away from its PATH and thus showcases relative outperformance in the mid cap category.
Average YTM
A metric relevant for debt mutual funds, Debt mutual funds are a portfolio of several individual bonds/securities with different and unique features like different maturities & different yields.
A fund’s Yield To Maturity (YTM) is the weighted average YTM of all its holdings. Average YTM is the total return that is expected from a fund if the investor holds it until maturity.
Average Maturity
A metric relevant for debt mutual funds, Debt mutual funds are a portfolio of several individual bonds/securities with different and unique features like different maturities & different yields.
A fund’s maturity is the weighted average maturity of all its holdings. Average maturity helps to determine the average time to maturity of all the debt securities held in a portfolio and is calculated in days, months or years. For e.g. a debt fund having an average maturity of 5 years constitutes debt securities held by the fund that, on an average, will mature in 5 years, though individual securities may have maturity different than 5 years.
Usually, longer maturity funds have a higher YTM for taking the additional duration risk keeping the other factors like credit quality constant.
Category YTM
Category YTM is the average YTM of all the funds within a category. Category YTM can be compared to individual fund YTMs to find out funds that are offering better returns than their category as a whole.
% Debt Holding
A pretty straightforward metric that represents the portion of the portfolio invested into debt assets.
% Equity Holding
A pretty straightforward metric that represents the portion of the portfolio invested into equity assets.
% Cash holding
This represents the portion of the portfolio invested into cash to either handle redemptions or to park the funds temporarily before a longer term allocation can be decided.
Your friend’s AMC has a hybrid strategy : a balanced advantage fund that as of 31st March 2021 is invested into 60% Equity & 40% debt. Then %Debt holding would be 40% & % Equity holding would be 60%
These are both dynamic factors and will change on a monthly basis either because of re-balancing or simply because of the fact that the equity portfolio will be more volatile than the debt portion.
% Large Cap Holding
Portion of the portfolio invested into large cap stocks
% Mid Cap Holding
Portion of the portfolio invested into mid cap stocks
% Small Cap Holding
Portion of the portfolio invested into small cap stocks
% Other Holding
Portion of the portfolio invested into stocks that cannot be categorized as large, mid or small caps
There are different categories of funds : Large caps, Mid caps, Small caps and at any given point a small cap fund is never generally invested into 100% small cap stocks. It has some portion of the portfolio allocated to mid caps or large caps or both.
For eg : your friend’s mid cap fund might have 70% mid cap holdings and 30% small cap holdings. We can use these filters to check which funds are staying true to their stated strategy and what allocation is being made to different market cap stocks.
% Concentration : Top 3 holdings
This metric represents the % portfolio made up by the top 3 holdings.
% Concentration : Top 5 holdings
This metric represents the % portfolio made up by the top 5 holdings.
% Concentration : Top 10 holdings
This metric represents the % portfolio made up by the top 10 holdings.
These metrics are a measure of concentration or diversification available in the strategy. Funds like sectoral funds & focused funds would have high concentration as compared to their counterparts.
For eg : In many popular focused funds, the entire portfolio is made up of 20-25 stocks where the top 10 make up for around 70% of the portfolio.
Investors who prefer a more diversified approach can use these filters to identify the concentrated portfolios available & filter them out.
% A rated bonds
A metric relevant for debt mutual funds, This represents the portion of the portfolio invested into good credit quality bonds that include the following ratings : AAA, AA+, AA, AA-, A+,A,A-,A1-A4.
% B rated bonds
A metric relevant for debt mutual funds, This represents the portion of the portfolio invested into low credit quality bonds that include the following ratings : BBB, BB+, BB, BB-, B+,B,B-.
% Poorly rated bonds
A metric relevant for debt mutual funds, This represents the portion of the portfolio invested into poor credit quality bonds that include the following ratings : C & D.
Debt mutual funds are a collection of several individual bonds/securities, each with its own credit quality & other unique features.
High credit quality bonds are safer but provide a lower yield (YTM). These should be preferred by investors who are looking for the least possible credit risk.
Low credit quality bonds have higher credit risk involved but offer a higher yield than bonds with better ratings, These are preferred by investors who are fine with taking additional risk for the additional yield.
% Sovereign bond holdings
A metric relevant for debt mutual funds, This represents the portion of the portfolio invested into debt issued by the government of India and is guaranteed by the government itself thus essentially carrying no credit risk. Credit risk implies a default of the issuer, i.e The inability of the borrower to pay back the borrowed amount.
% Corporate bond holdings
A metric relevant for debt mutual funds, This represents the portion of the portfolio invested into debt issued by private companies and its credit quality depends on the financials of the company issuing it, it is not backed by the government of the country. It can range from AAA rated to C/D rated assets.
Investors can use these metrics to find out strategies that match their investment needs the best. An investor that prefers bonds with the least credit risk would prefer funds with higher allocation to sovereign debt.
SEBI risk category
All AMCs have to assign one of 5 risk categories defined by SEBI to their MF strategies. The rating is assigned based on the level of risk of the strategy.
The 5 levels of risk defined by SEBI are :
- Low – principal at low risk
- Moderately Low – principal at moderately low risk
- Moderate – principal at moderate risk
- Moderately High – principal at moderately high risk
- High – principal at high risk
For eg : The small cap fund managed by your friend’s AMC would be categorized as “High risk” as equity as an asset class is volatile, on the other hand the corporate bond fund that invests most of its funds into AA & above rated bonds issued by corporates would be categorized as “moderate risk” as the risk to capital invested is much lower than equity strategies.
Tracking error
An important metric for Index funds. From a broad perspective, it is the annualized standard deviation of the difference in returns between the fund and its respective benchmark.
The purpose of an index fund is to track the benchmark one to one in terms of both volatility and performance. Theoretically the best tracking error is 0, but costs related to handling and managing funds lead to non zero tracking errors. A low tracking error should be looked for when investing into any index fund.
Volatility/ Standard deviation
Standard deviation shows how dispersed the returns of the fund are over a specific horizon relative to the mean. Standard deviation & volatility are used synonymously.
A lower standard deviation doesn’t always mean that the fund is better thus the metric should not be looked at alone. For eg : Fund A has a standard deviation of 15% and a return of 20% ( annualized figures ), on the other hand, Fund B has a standard deviation of 12.5% and a return of 10% ( annualized figures ): We can see that even though Fund B is less volatile, the returns are half of that of Fund A.
Standard deviation should be looked at along with other factors like returns over different horizons. Different categories of funds will have different standard deviations. Small Cap funds are generally more volatile and thus have higher standard deviation than large cap funds, but they also have different return profiles.
Category standard deviation
Category standard deviation, as the name states, is the average of standard deviation of all the funds in a particular category.
For eg : Let’s assume there are 5 funds in the small cap category :
| Fund | Std Dev |
| A | 15% |
| B | 17.5% |
| C | 20% |
| D | 22.5% |
| E | 25% |
This makes the category Standard deviation : (15%+17.5%+20%+22.5%+25%)/5 = 20%
We can use the Category standard deviation to compare individual funds to the average to see where the fund stands in terms of volatility in its category.
Maximum Drawdown
A maximum drawdown (MDD) is the maximum observed loss from a peak to a trough of a portfolio, before a new peak is attained. Maximum drawdown is an indicator of downside risk over a specified time period.
The metric is used to assess the relative riskiness of a strategy to another.
It focuses on capital preservation and funds with a lower MDD (keeping other factors constant) are better.
For eg : There are 2 funds
Fund A : Standard dev : 12.5%, Average returns : 15% & MDD = 25%
Fund B : Standard Dev : 12.5%, Average returns : 15% & MDD = 30%
Fund A should be chosen over fund B based on these metrics.
AMC
An asset management company (AMC) is a firm that invests pooled funds from clients, putting the capital to work through different investments including stocks & bonds. AMCs are colloquially referred to as money management firms.
Benchmark
After setting up his AMC, he launches several Mutual fund Strategies :
Equity Strategies : Large Cap Fund, Mid Cap Fund, Multi cap Fund etc.
Debt strategies : Corporate Bond Fund, Short Duration Fund etc
Now he needs to specify the benchmark for each of his strategies so that he has something to compare his performance against. Benchmarks also allow the investors to see if they have invested in good strategies or not.
A benchmark is a standard against which the performance of a security, mutual fund, or investment manager can be measured. Generally, broad markets like Nifty 50, Nifty 500 and bond indexes like Crisil Corporate bond Index are used for this purpose i.e. benchmarks are indexes created to include multiple securities representing some aspect of the total market. Benchmark indexes have been created across all types of asset classes.
It is important that benchmarks are relevant to the strategy of the fund, for example if the fund belongs to the large cap category then its benchmark should be Nifty 50 and not a mid/small cap index.
Expense ratio
At the end of the day, your friend is in the business of making money for both the people invested in his funds and himself. He charges the people invested in his funds for running and managing the funds, This % he charges is called the TER (total expense ratio). The TER covers : sales & marketing / advertising expenses, administrative expenses, transaction costs, investment management fees, registrar fees, custodian fees, audit fees.
An expense ratio (ER) measures how much of a fund’s assets are used for administrative and other operating expenses. An expense ratio is determined by dividing a fund’s expenses by the average value of its assets under management. The TER is calculated as a percentage of the Scheme’s average Net Asset Value (NAV). The daily NAV of a mutual fund is disclosed after deducting the expenses. Expenses reduce the fund’s assets, thereby reducing the return to investors.
NAV
As more people invest in the strategies, The fund manager of the strategy goes ahead and invests that money into stocks, bonds and other assets.
In return of the money that investors invest, they receive units that are proof of their ownership.
Investors track the value of their investments through the NAV (net asset value) of their units where the NAV = (total net value of the fund)/(total units issued by the fund)
Mutual fund net asset value (NAV) represents a fund’s per share market value. It is the price at which investors buy/sell fund units from/to a fund company. It is calculated by dividing the total value of all the cash and securities in a fund’s portfolio, less any liabilities, by the number of units outstanding. NAV of a fund moves on a daily basis depending on how the underlying assets of the fund perform.
Minimum Lump Sum
Minimum lump sum amount is pretty straightforward, It is the minimum amount we can invest in a fund and It varies from fund to fund.
Minimum SIP
Investing lump sum is not the only way of investing into mutual funds, people choose the SIP ( systematic investment plan ) for regular investments into funds where no manual transactions are needed and money is deducted in a predetermined fashion as decided by the investor. Minimum SIP amount is the minimum amount that can be invested into funds through the SIP route and like lump sum investments, it varies from fund to fund.
Lock-in
Lock-in periods are the horizon for which any investor cannot redeem their invested amount from their date of investment.
Majority mutual funds are open ended and thus have no lock-in periods unless stated otherwise. Most popular category of MFs with a lock-in are ELSS funds that are used for tax saving purposes under 80C and have a lock-in period of 3 years.
For eg : one of the funds managed by your friend’s AMC has a lock-in of 2 years and you invest in his fund on 31st March 2021 then you will not be allowed to redeem your investment before 31st March 2023.
Time since inception
Time since inception is a pretty straight forward metric, It measures the age of the fund.
For eg : A fund started in March 2018 would have an age of 36 months or 3 years in March 2021.
Exit load
An exit load refers to the fee that the Asset Management Companies (AMCs) charge investors at the time of exiting or redeeming their fund units. Exit loads are generally applicable for the first couple of years or months depending on the fund. Exit loads are meant to penalize investors for exiting investments before their recommended investment horizon.
Exit loads are more popular in Equity funds as equity funds are preferred for longer horizon investments. These also vary from fund to fund.
Exit loads are applicable on the current value of the investment and not the invested value. For eg, The large cap fund managed by your friend’s AMC has an exit load of 1% for the first 12 months of investment. You had invested Rs. 10,000, 2 months ago which has now grown to Rs.11,500 and now you want to exit the fund. You will have to pay 1%*11,500 = 115 as an exit load to the AMC. Exit loads are deducted automatically by the AMC so you will receive 11,500 – 115 = Rs.11,385 in your bank account.
Fund Manager
Fund manager is the key person when it comes to Mutual funds; fund managers decide the asset allocation, market cap allocation, entry & exit into stocks & all the other major decisions involving the strategy & its implementation.
Broadly, Fund managers can be categorized into the following types as per the strategy they follow:
Growth :
The managers using this style have a lot of emphasis on the current and future Corporate Earnings. They are even prepared to pay a premium on securities having strong growth potential. The growth stocks are generally the cash-cows and are expected to be sold at prices in the northern direction.
Value :
Managers following such a response will thrive on bargaining situations and offers. They are on the hunt for securities that are undervalued about their expected returns. Securities could be undervalued even because they do not hold preference with the investors for multiple reasons.
Growth at a reasonable price :
The Growth at Reasonable Price style will use a blend of Growth and Value investing for constructing the portfolio. This portfolio will usually include a restricted number of securities that are showing consistent performance. The sector constituents of such portfolios could be slightly different from that of the benchmark index to take advantage of growth prospects from these selected sectors since their ability can be maximized under specific conditions.
Fundamental Style :
This is the basic and one of the most defensive styles which aim to match the returns of the benchmark index by replicating its sector breakdown and capitalization. The managers will strive to add value to the existing portfolio. Such styles are generally adopted by mutual funds to maintain a cautious approach since many retail investors with limited investments expect a necessary return on their overall investment.
Quantitative Style :
The managers using such a style rely on computer-based models that track the trends of price and profitability for identification of securities offering higher than market returns. Only necessary data and objective criteria of protection are taken into consideration, and no quantitative analysis of the issuer companies or its sectors are carried out.
Risk Factor Control :
This style is generally adopted for managing fixed-income securities which take into account all elements of risk such as:
- Duration of the portfolio compared with the benchmark index
- The overall interest rate structure
- Breakdown of the deposits by the category of the issuer and so on
Bottom Up style :
The selection of the securities is based on the analysis of individual stocks with less emphasis on the significance of economic and market cycles. The investor will concentrate their efforts on a specific company instead of the overall industry or the economy. The approach is the company exceeding expectations despite the sector or the economy not doing well.
Top Down Style :
This approach of investment involves considering the overall condition of the economy and then further breaking down various components into minute details. Subsequently, analysts examine different industrial sectors for the selection of those scripts which are expected to outperform the market.
Screener Filters
This module describes all the filters used in screener
You can add these Filters in your screener by clicking the Add Filter button on the bottom left
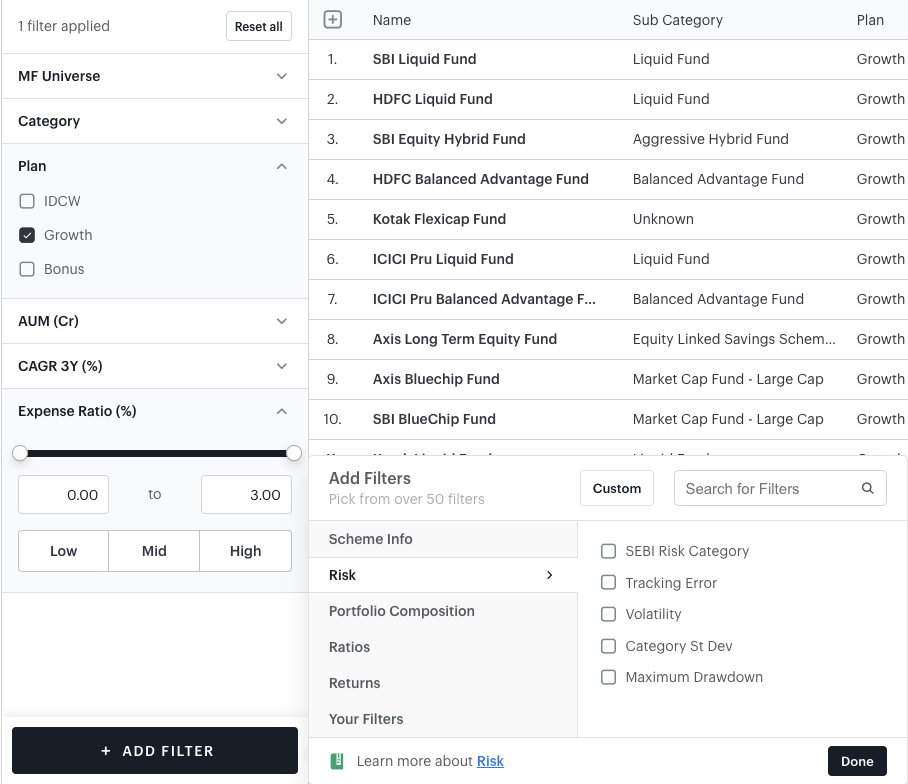
In order the Filter categories appear on screener
- Chapter 1 – Scheme Info
- Chapter 2 – Returns
- Chapter 3 – Risk
- Chapter 4 – Portfolio Composition
- Chapter 5 – Ratios
- Chapter 6 – Custom Filters
Happy Screening!!!