When investing in an asset, checking only its returns is not enough. You need to understand the risks involved too. Now, some metrics assess the risk-adjusted return of an asset to analyse whether it is a suitable investment avenue. The Sharpe ratio is one such ratio.
But what is Sharpe, and what is the importance of this ratio? Let’s understand the Sharpe ratio meaning and what it is all about!
You will Learn About:
What is the Sharpe ratio?
The Sharpe ratio is a technical ratio that measures the risk-adjusted returns of an asset, i.e. it shows how much return your invested asset will generate for the amount of risk you take by investing in it.
Developed by the Nobel Prize-winning economist William F. Sharpe, the Sharpe ratio measures the additional returns you can earn from an asset by exposing yourself to its risks. The higher the returns, the better the asset is considered to be.
Return on equity: Highlights
- The Sharpe ratio measures the risk-adjusted returns of an asset.
- It is calculated by dividing the excess returns over the benchmark return with the standard deviation(total risk of the asset).
- The Sharpe ratio can help you compare assets and choose one that offers higher returns (compared to the risk of investing in them).
- An ideal Sharpe ratio is one or greater than 1.
How to calculate the Sharpe ratio of a portfolio?
To calculate the Sharpe ratio, three vital inputs are needed. They are: –
- The risk-free rate of return
- The expected return from the asset
- The standard deviation of the asset’s returns.
These three aspects are then employed in the Sharpe ratio formula to determine whether the asset is a good investment avenue.
Sharpe ratio formula
The Sharpe ratio is calculated as follows –
Sharpe ratio = (Expected returns from the asset – the risk-free rate of return) / standard deviation of the asset’s excess returns.
Sharpe ratio example
To understand how the ratio is calculated, let’s take the following example –
A mutual fund has an expected return of 12% per annum. The risk-free rate of return is 7%, and the fund’s standard deviation is 4%. In this case, the Sharpe ratio would be calculated as follows –
Sharpe ratio = (12% – 7%) / 4% =1.25
What can the Sharpe ratio tell you?
The Sharpe ratio interpretation can give useful insights into an asset or a portfolio. Here’s what the ratio can tell –
- An asset’s performance vis-à-vis its competitors
You can use the ratio to assess how an asset or fund is performing against similar assets or funds. This would help you understand whether the asset is giving you better returns than its competitors. For instance, if the Sharpe ratio of two blue-chip funds, A and B, is 1.5 and 1.75, respectively, fund B is better than fund A since it gives a higher return for the same level of risk.
- Performance against the benchmark
The risk-free rate of return used in the calculation of the ratio is the benchmark return. It is usually measured as the return offered by Government securities. These returns are the benchmark returns that your money can get without taking on any risks. The Sharpe ratio measures how the asset is performing against the benchmark.
If the ratio is high or positive, the return outperforms the benchmark. On the other hand, a negative ratio means that the asset is returning below the benchmark returns.
- The risk-return trade-off
Lastly, the ratio assesses the risk-return trade-off. It helps you check whether the investment risk of the portfolio is worth it by measuring the returns it generates. It helps you know whether your invested asset generates returns to compensate for the risk you are taking.
What is a good Sharpe ratio?
The calculated Sharpe ratio can be put into different categories to check whether it is good, bad or average. Have a look –
| Ratio value | Interpretation |
| Less than 1 | Bad |
| 1 to 1.99 | Good |
| 2 to 2.99 | Very good |
| 3 and above | Excellent |
Advantages and disadvantages of the Sharpe ratio
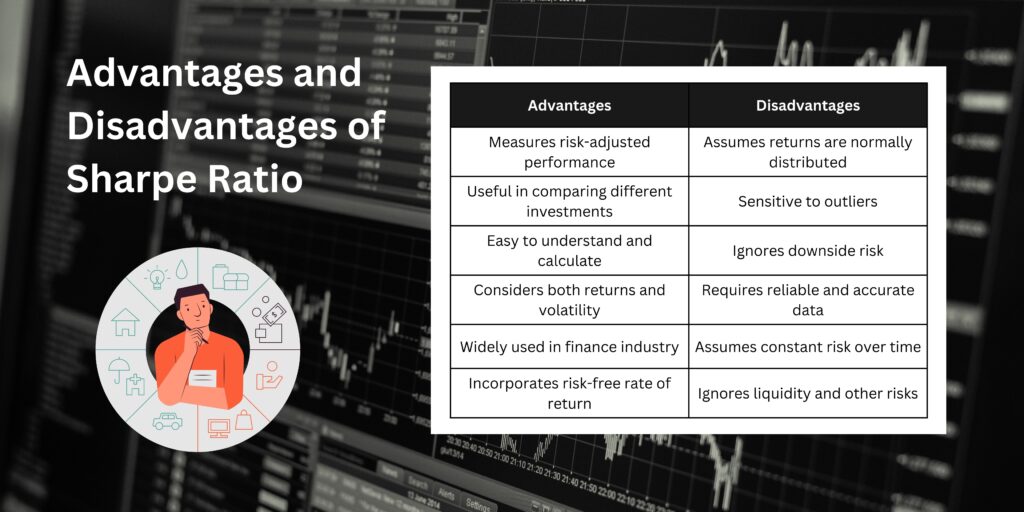
The ratio has both advantages and disadvantages. These are as follows –
Advantages of the ratio
- Ease of calculation
- Helps in comparing different types of investment options
- Aids in making investment decisions
- Can assess if the asset is outperforming the benchmark or not
Disadvantages of the ratio
- The ratio can be easily manipulated by changing the time intervals for calculating the standard deviation. For instance, standard deviations on an annual basis are lower than that on a monthly basis. Thus, to downplay risks, analysts can consider annual returns and manipulate the ratio.
- The volatility is calculated using the normal distribution, which might not always be an accurate indicator of the financial markets.
Alternatives to the Sharpe ratio
There are other ratios too that serve as alternatives to the Sharpe ratio. These ratios are as follows –
- Sortino ratio
Unlike the Sharpe ratio, the Sortino ratio only considers the downside deviation of the portfolio to better assess its risks. The standard deviation used in the Sortino ratio checks the variance of the returns that are negative or less than the benchmark rate against the average returns to give a better picture of the fund’s risk-adjusted returns.
- Treynor
The Treynor ratio also uses a different denominator compared to the Sharpe ratio. Under the Treynor ratio, the denominator is the Beta of the asset (that checks the systematic risks). The ratio measures if you are enjoying higher returns for the extra risks you take.
Conclusion
The Sharpe ratio is a good measure to check the returns vis-à-vis the risks you undertake. Analysts use the Sharpe ratio as an important metric to judge mutual funds. The portfolio’s Sharpe ratio can help you determine how it is performing. Moreover, by comparing the ratio across other funds, you can pick the right mutual fund to invest in by comparing the ratio across other funds. So, understand what the ratio is all about, how to calculate the Sharpe ratio and its advantages. Also, know the limitations of the ratio and use it in conjunction with other metrics when making investment decisions.

 – Meaning, Calculation, Difference With ROCE And ROI, And More")
