Last Updated on Apr 18, 2022 by Anjali Chourasiya
Harsh Vora is a proprietary investor and day trader with more than 10 yrs of experience in financial markets and is interviewed on ET NOW.
There are two fundamental ways to participate in the financial markets, which encompass a wide range of assets – from the traditional instruments like stocks, bonds, real estate, and commodities to new-age instruments such as cryptocurrencies. One way to participate in the markets is through short-term trading using technical analysis. And the other, of course, is through long-term investing using fundamental analysis.
While technical analysis includes analysing chart patterns and historical price behaviour to gauge future price movements, fundamental analysis involves scouring through annual reports, conference call transcripts, exchange filings, and more to gauge the expected cash flow from the business in future.
Behind every stock is a business. Fundamental analysis of a stock, therefore, could take days or even weeks to complete. And yet, if one knows what factors to look for and where, they could save immense time and effort. In this article, we will briefly discuss one such factor that could make your analysis simpler: ‘Capital allocation by the company’.
Table of Contents
Concept of capital allocation
Remember, from the first principles, that the primary objective of a for-profit company is to maximise wealth for its shareholders, who are the owners of the business. This maximisation of wealth can happen either through stock price appreciation or dividend income. This bodes the question: What factors help increase the stock price of a company?
One major factor is how the managers of a company allocate the capital raised by it – whether equity or debt. Efficient deployment of the capital, in a way that generates the best bang for the buck, attracts investor benevolence. Conversely, a company that engages in poor capital allocation destroys shareholder wealth.
Return on capital employed (ROCE)
How do we know whether the company has been a good capital allocator? A powerful financial metric that helps instantly gauge a company’s capital allocation record is the return on capital employed (ROCE), which is simply the profit earned by the company on its capital.
The formula is earnings before interest and taxes or EBIT divided by the company’s capital, which is measured as total assets minus current liabilities. Why do we subtract current liabilities from total assets? It’s because those are liabilities that will have to be paid in the current year, thus reducing the overall capital this year.
A company that is able to churn out a greater profit from its existing capital base is rewarded disproportionately by the market. In fact, a 2011 study by PwC of listed BSE 100 companies found that “on an average, companies that deliver a better return on capital employed experience higher valuation”.
Acrysil: Illustrating the significance of ROCE
There are ample examples of where companies that delivered better ROCE experienced higher valuation. For the purpose of this article, we will look at Acrysil, which is Asia’s only manufacturer of composite quartz kitchen sinks. Acrysil’s return on capital employed in FY 2021 was 22.5%, which means the company generated a profit of Rs 22.5 on every Rs 100 invested in the business whether in the form of equity or debt.
Note that from an investment perspective, a ROCE of greater than 20% is exceptional for a business. High ROCE means the company would make the most efficient use of any incremental capital raised by the company.
To Acrysil’s benefit, its commissioning of additional sink manufacturing capacities over the last couple of years has meant the market accorded a premium valuation to its stock. From a capacity of 7 lakh sinks per year, Acrysil expanded its manufacturing to 8.4 lakh sinks per year in October 2021. It has further announced an expansion of up to 3.6 lakh sinks by Q2 FY 2023, taking its total capacity to 12 lakh sinks per year. This is about a 70% increase in manufacturing capacity over the next 2 yrs at a total estimated cost of Rs 73 cr.
How is the market viewing the company’s decision to spend Rs 73 cr. on capacity expansion? Let’s look at its stock price behaviour in the recent months:
Since April 2021, Acrysil’s stock price has surged by a staggering 250%, from Rs 320 levels in April 2021 to Rs 820 levels in December 2021. Evidently, the market has been rewarding the company’s capital allocation decisions quite well. If you had been tracking the company’s ROCE profile together with its capacity expansion announcements since the start of this year, you’d have reaped handsome gains from investing in this company.
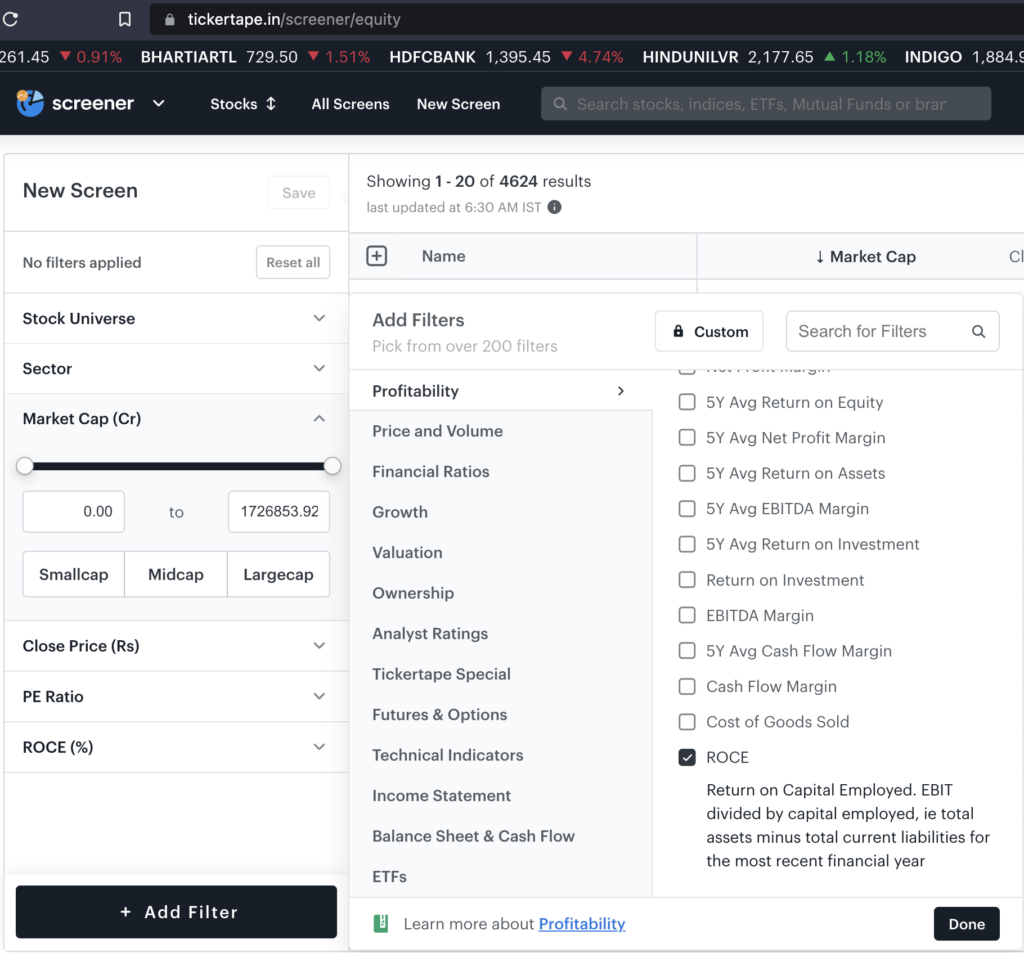
So, use Tickertape’s Screener and select the ROCE filter under the profitability ratios. Then, add a threshold of 20% as your input.
See which companies qualify for this threshold. In the forthcoming articles, we will also look at some other important factors, including earnings growth and management quality, which you can use in conjunction with ROCE to identify rock-solid businesses.