Last Updated on Oct 29, 2021 by Ayushi Mishra
Traders and analysts use many technical analysis tools when picking stocks or when attempting to predict the stock’s future movements. The technical analysis tools consider the historic price movements of stocks and then make trend and momentum analysis. One technical indicator that is popularly used is the MACD indicator. Let’s understand what MACD is and how it works.
Table of Contents
This article contains:
- What is MACD?
- Construction of the MACD indicator
- Using the MACD indicator to read trade signals
- The concepts of convergence and divergence
- MACD trading strategies
What is MACD?
The MACD full form is Moving Average Convergence Divergence. MACD is a technical indicator that indicates the trend and momentum of a stock by using its Exponential Moving Average (EMA). The MACD measures the relationship between the EMAs of two periods and helps the investor make decisions for trading.
Construction of the MACD indicator
The MACD indicator consists of the following things:
- A MACD line
- A signal line
- A histogram
Using these three inputs, the MACD chart is drawn which, then, tells the supposed market trends, based on which an investor can take a call on whether to buy or sell a stock.
The value of all the aforementioned inputs is derived as follows:
- MACD line = 12-period EMA – 26-period EMA
- Signal line = 9-period EMA
- Histogram = MACD line – signal line
Here’s how the MACD indicator looks:
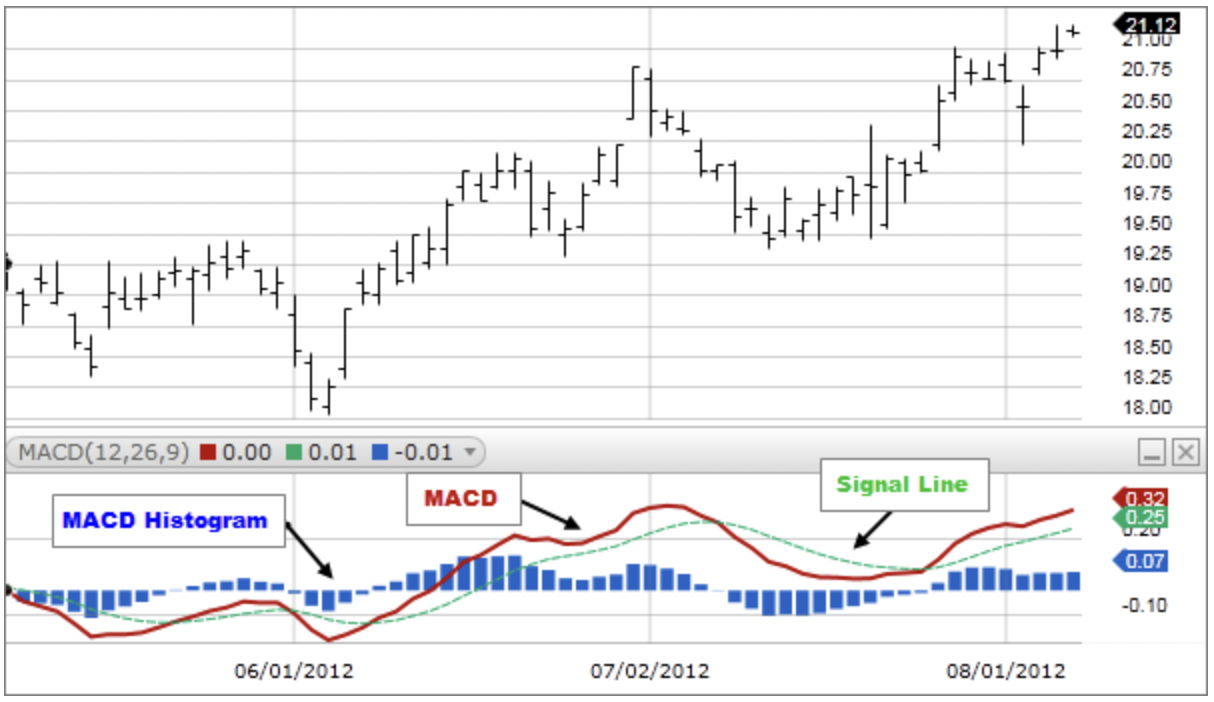
Using the MACD indicator to read trade signals
The MACD shows an uptrend or downtrend in the market and helps you know when to buy or sell. Here’s how you can use the MACD crossover with other lines to read trade signals:
Using the MACD line and 0-line
The MACD and zero lines, when used together, show the market trend. Here’s how:
- When the MACD line crosses above the zero line, it signals an uptrend
- When the MACD line crosses below the zero line, it signals a downtrend
Using the MACD line and the signal line
The MACD line, together with the signal line can pinpoint when to buy and when to sell. Here’s how:
- When the MACD line crosses above the signal line, it is a good time to buy
- When the MACD line crosses below the signal line, it is a good time to sell
The concepts of convergence and divergence
While the MACD crossover is an important indicator, you also need to understand the concepts of convergence and divergence, two important aspects of the MACD.
The aspects of convergence and divergence are studied in histograms that measure the difference between the MACD line and the signal line. Each histogram shows the difference between the changing MACD and signal lines. Thus, if the histograms converge, the difference is small. It indicates a trend reversal, i.e. a change in the existing trend in the market. On the other hand, if the histograms diverge, i.e. move apart, it means that the difference between the MACD and signal lines is increasing. This signals the continuity of the existing trend in the market.
MACD trading strategies
Based on the reading of the MACD crossovers and the convergence and divergence of the histogram, three distinct MACD strategies emerge.
The crossover strategy
Under this strategy, the MACD and signal lines are considered and then trading strategies are made based on how the MACD line crosses the signal line. If the MACD line crosses from above, it indicates an opportunity to buy the stock. Conversely, if the MACD line crosses the signal line from below, it indicates an opportunity to sell as the market is seen to be bearish.
The crossover strategy is considered a lagging strategy because it is based on past price movements. By the time the strategy gives an indication, the price might be poised for a reversal. As such, the strategy can often produce a ‘false signal’.
The histogram reversal strategy
This strategy is quite popular as it usually gives the right indications and helps traders make the right investment choices. Under this strategy, the histograms are studied. If they increase in height, it shows that the market is moving quite strongly. On the other hand, if the histogram shrinks, it signals the slowing down of the market movement.
This strategy is called a leading strategy because known trends are used as the basis of placing positions. As such, the histogram reversal happens before the movement of the market and helps traders take their positions beforehand.
The zero-cross strategy
Under this strategy, the MACD and the zero lines are used together to analyse the price movements. If the MACD line crosses the zero line from above, it indicates the start of a bullish market. You should buy or close your short position in such a scenario. On the contrary, the MACD line crossing the zero line from below heralds a bearish market. You should sell or close your long position in this scenario.
Conclusion
MACD indicator is an important tool in technical analysis. You can use the MACD indicator when you trade in shares. The indicator can signal an uptrend or downtrend in the market and the different trading strategies can help you time your entry and exit from the market. So, understand the concept of MACD before you start trading in stocks.

")