Last Updated on Oct 5, 2021 by Aradhana Gotur
This article is written by Nooresh Merani, the founder of Analyse India. He is known to popularise the Techno-Funda style of investing. Check out smallcases by Nooresh Merani.
Bull Markets are identified when the stocks and indices, in general, are making new 52-week highs and all-time highs. Bull Markets tend to be several years in length and are always preceded by and ended by Bear Market.
As the stocks recover from their 52-week lows to their 3 mth, 6 mth or 52-week highs, a Bull Market starts. The majority of stocks, as they recover, form the Higher Top and Higher Bottom formation, this in basic confers to the Dow theory.
A classical graphical presentation
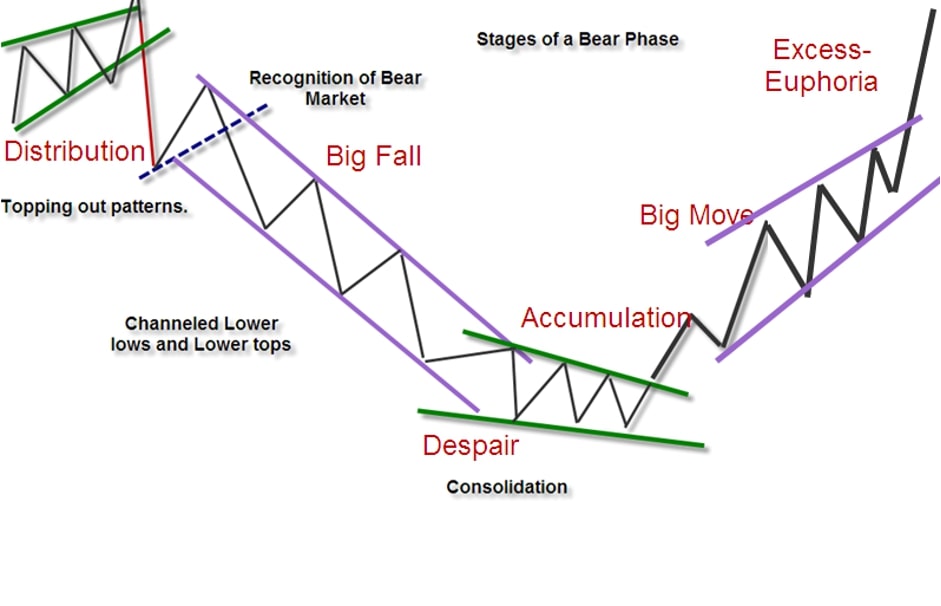
Table of Contents
Let’s look at Nifty50 recently
Higher Tops and Higher Bottoms confirm a trend change and a Bull Market. So one would realize it’s a Bull Market at 3 or at any of the arrows.
Even buying at pre-COVID highs above 12,000 would not be late in a Bull Market.
The biggest problem is Bias which I like to call “Fear of Gravity”.
Fear of Gravity
Anything that goes up fast has to come down. In the recent past, which was a Bear Market, stocks would have fallen 30-60%. So, any stock that rises fast creates a lot of fear.
This fear gets higher because, after a Bear Market, most of us tend to the recent past. This results in either no participation on the way up or book profits quickly.
In a Bull Market, money is either made by sitting and riding through the Bullish Phase or by adding on the way up.
With the stocks going up, the headline and small-cap indices also make fresh 52-week highs.
Identifying stocks during a Bull Market
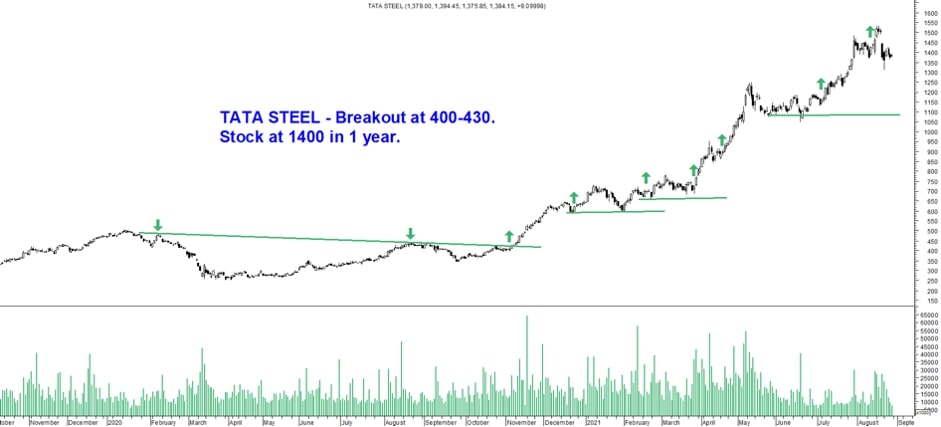
New 3 mth / 6 mth / 52-week high / All-time high
In a Bull Market, identifying stocks is a relatively simpler task where you focus on companies that are hitting fresh 3 mth / 6 mth / 52-week high / All-time high and stay invested as long as the Bull Market continues
Some bullish chart patterns to identify stocks
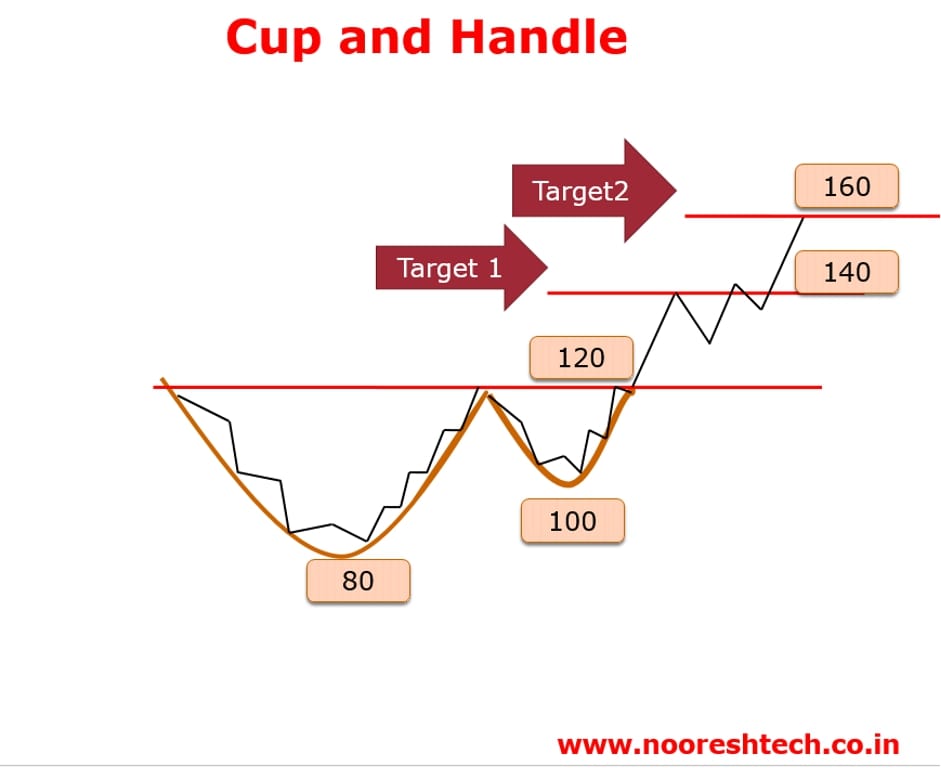
Cup and Handle
In an up-trending stock, there is a time when it corrects a significant portion of its up move. Only a few stocks can recover after such correction. The ability of the stock to test its previous highs again makes it interesting in terms of the underlying fundamentals. As the stock crosses its previous highs in 2-3 attempts of testing the same highs, the pattern that forms looks like a Cup and Handle. A breakout above this high is a good bullish indicator.
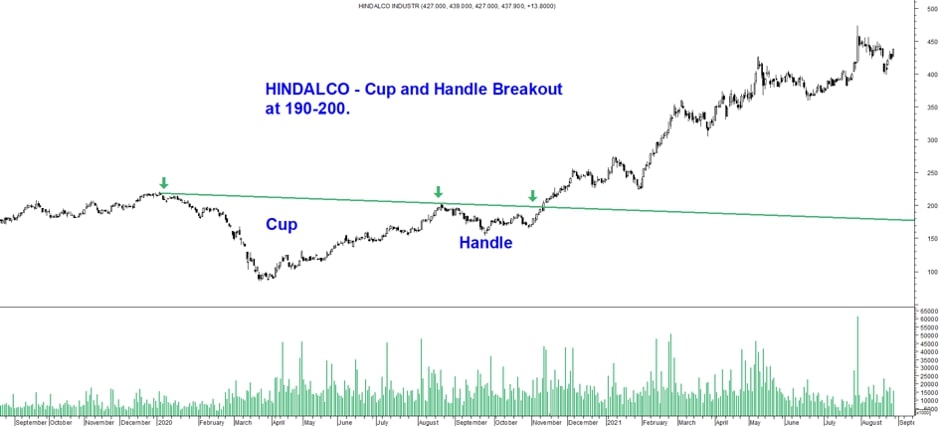
Stock chart example – Hindalco
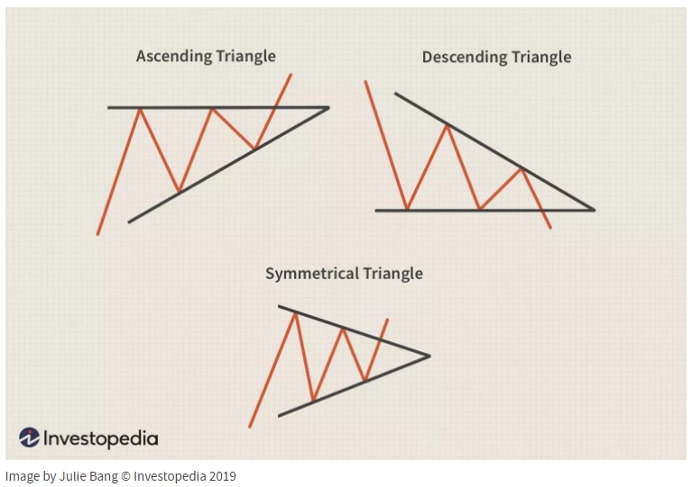
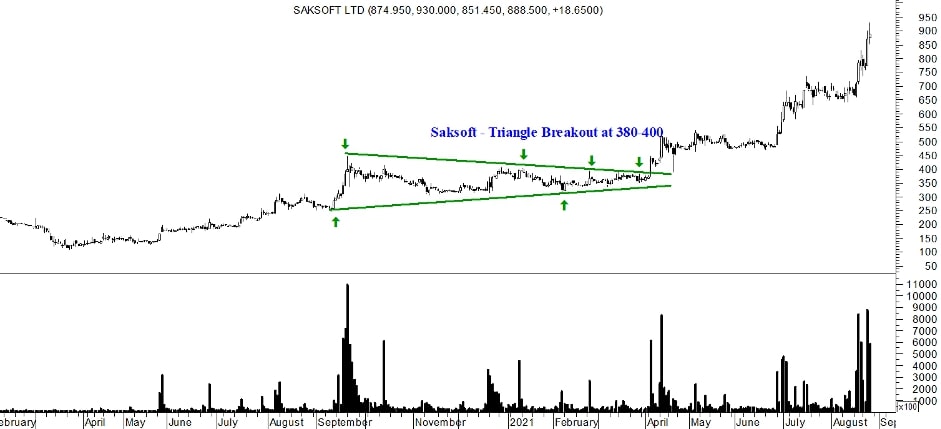
Triangle
A triangle chart pattern is nothing but the narrowing of movement in a price range in such a manner that when you draw a trendline, it forms the shape of a triangle. Stocks do not have the tendency to stay in range for a long time and hence a price breakout of this range on the upside is a bullish chart pattern.
Stock chart example – Saksoft Limited
Price Volume
A simple price volume scanner can also give suggestions of a trending stock. Also, this scan should be made for stocks that are breaking out and not for stocks that are showing reversal.
Some simple scans
- 5% Price Increase and 5x Volumes
- 10% Price Increase and 10x Volumes
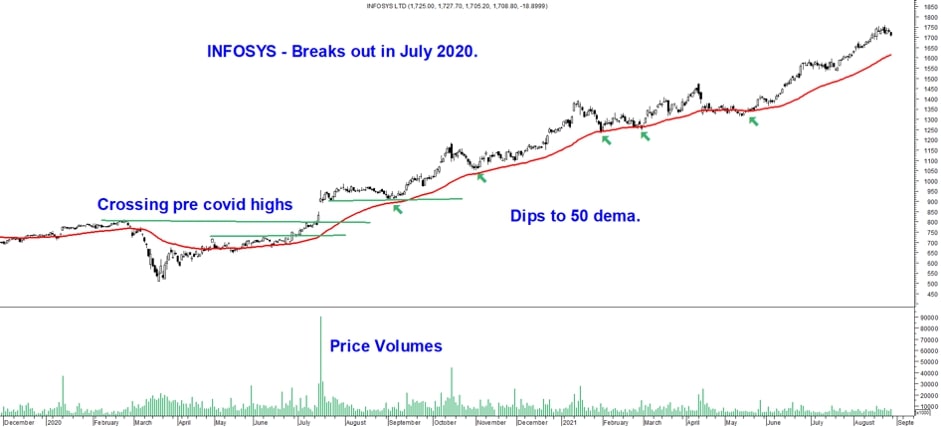
Buying the dips
Once you have identified stocks making new highs on basis of chart patterns, the other way to invest in a Bull Market is to buy small dips when the market gives a small pullback move in such stocks (called a retest of a breakout).
When the long-term trend is positive, such dips provide you with a good opportunity to enter stocks that give a good risk-reward setup. In a Bull Market, you will see stocks taking support at important moving averages or major swing lows.
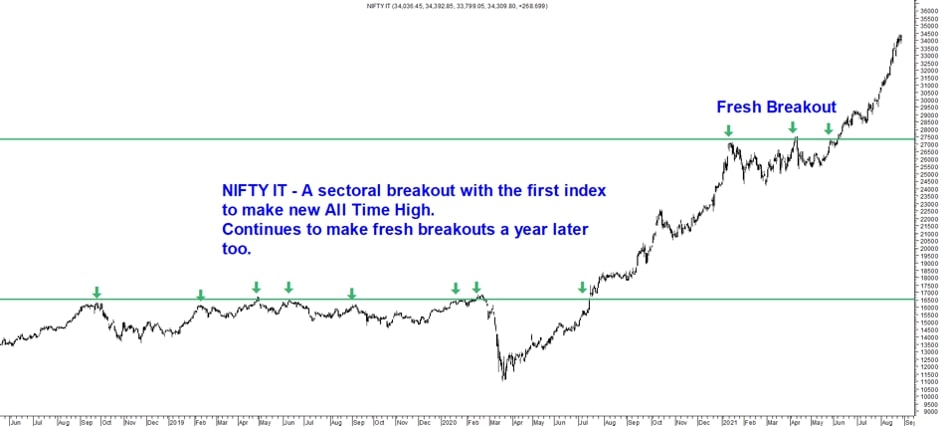
Sectoral picks
In a Bull Market, you would find a certain sector outperforming the headline index. Such outperformance can be played by investing in stocks of that sector. You can take a top to bottom approach, wherein if you see a sector breaking out, you will see good stocks from that sector breakout first and the momentum trickles down to not so good companies breaking out in the later stage.
Generally, the leadership sector is the one that is the first one to breakout into new all-time highs even when the benchmark indices have not.
Buying vs staying invested
More than identifying a Bull Market and finding stocks, it is important to stay invested in such a Bull Market without getting stopped out on small corrections. The majority of investors and traders fail here. In a Bull Market, no high is high enough, not to be broken. In other words, as the stock hits a new all-time high and enters the unchartered territory, it can keep making fresh new highs so it becomes difficult to predict where it would stop. The idea is to ride the trend until it lasts.
Riding the trend in a Bull Market
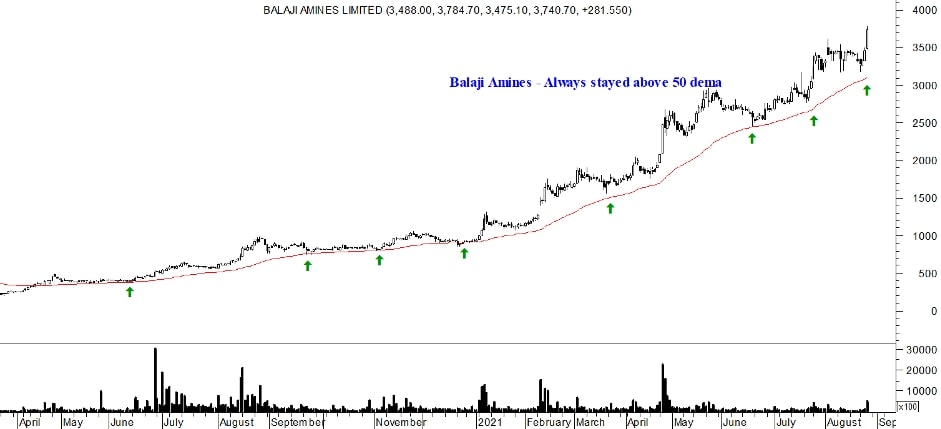
One can ride using the major moving average as a trailing stop loss (50 or 200-day moving averages). Additionally, major swing lows can also be considered as a stop loss for any trade. As the major swing lows break and sustain on the downside, one may exit the long trade.
Example – Balaji Amines – Above Important Moving Average

- Muhurat Trading – Then and Now - Oct 28, 2021
- Bull Market: Identifying Stocks and Riding the Trend - Oct 4, 2021
")